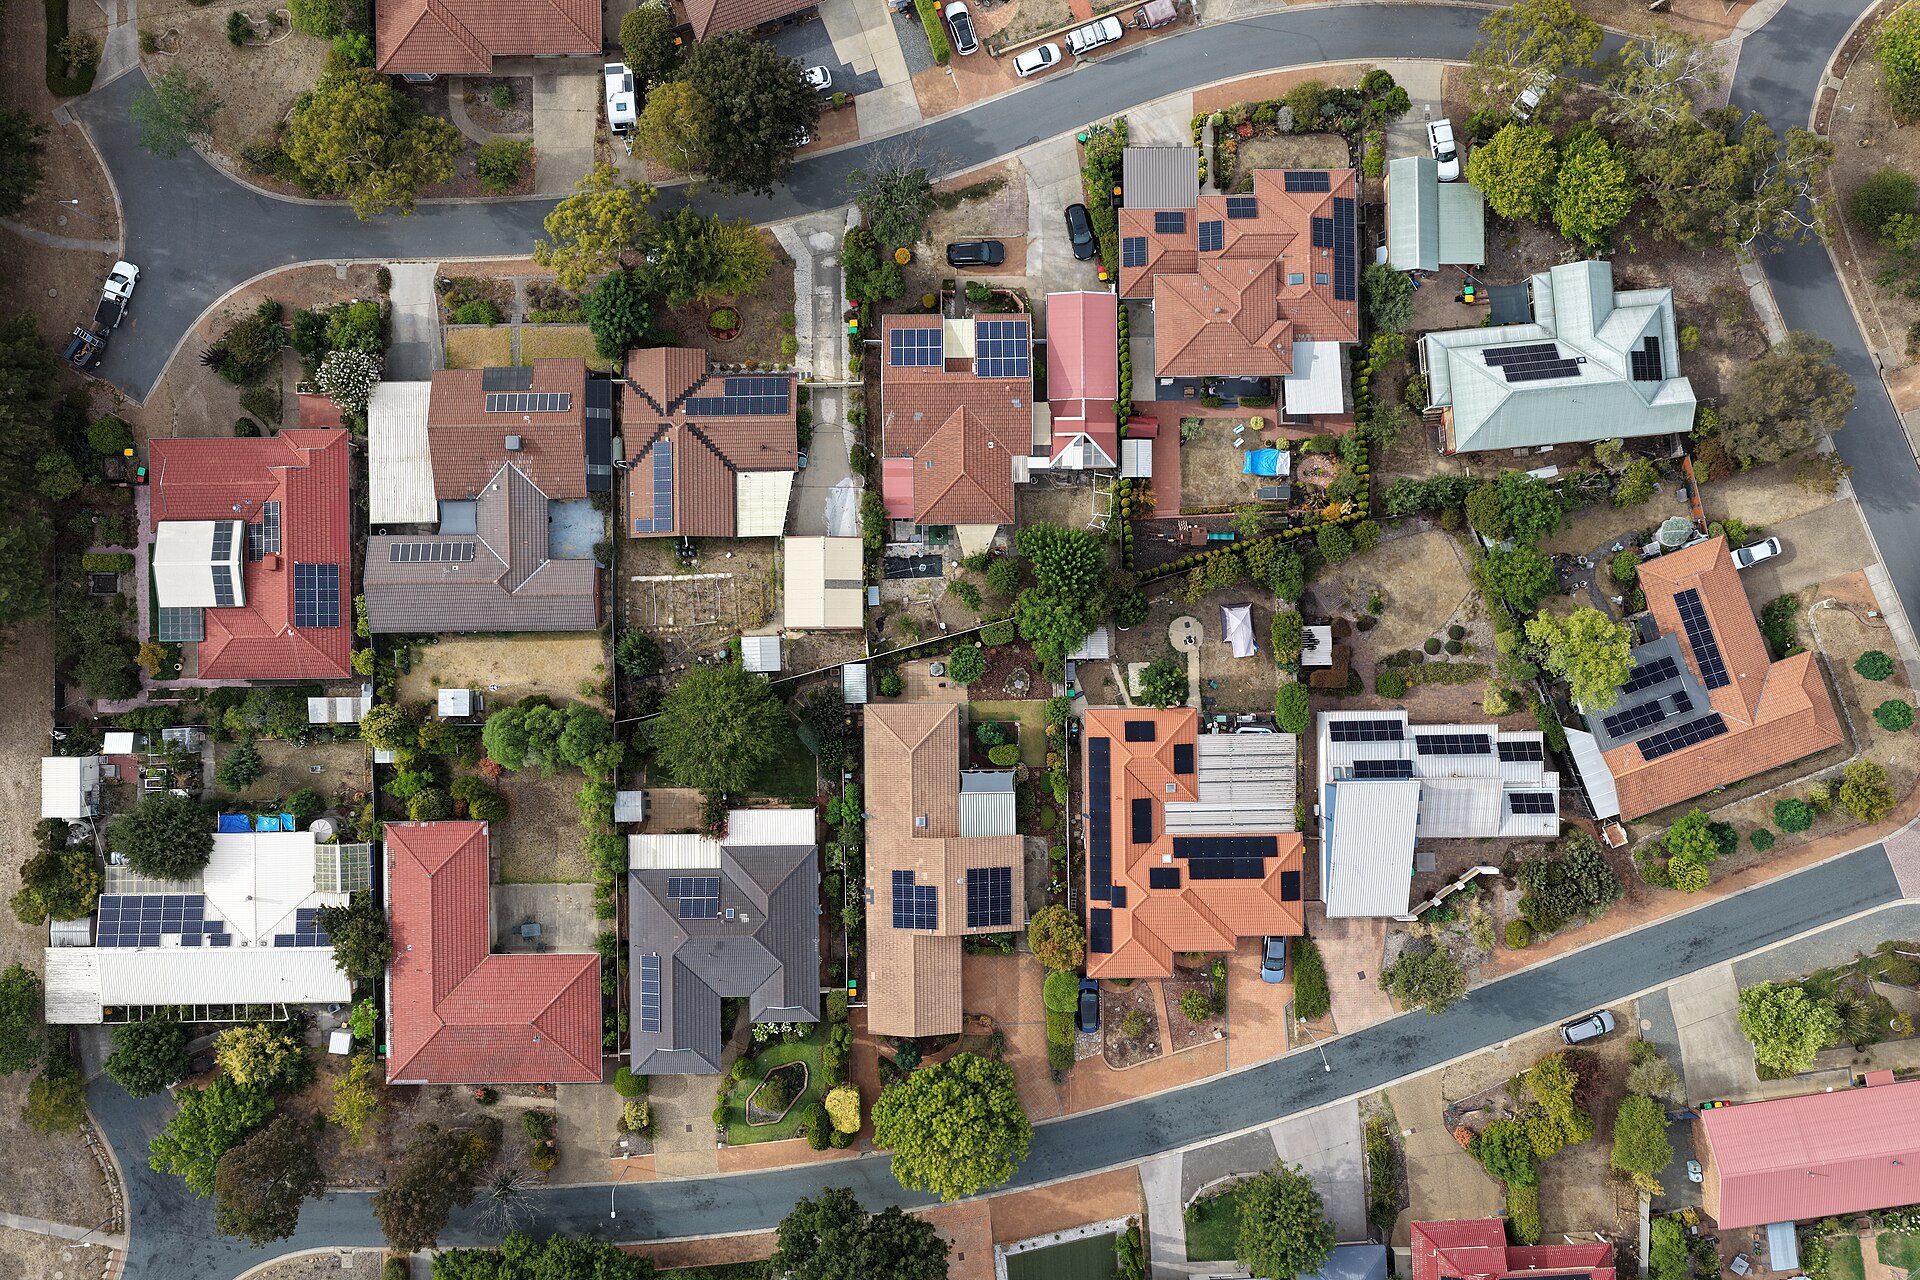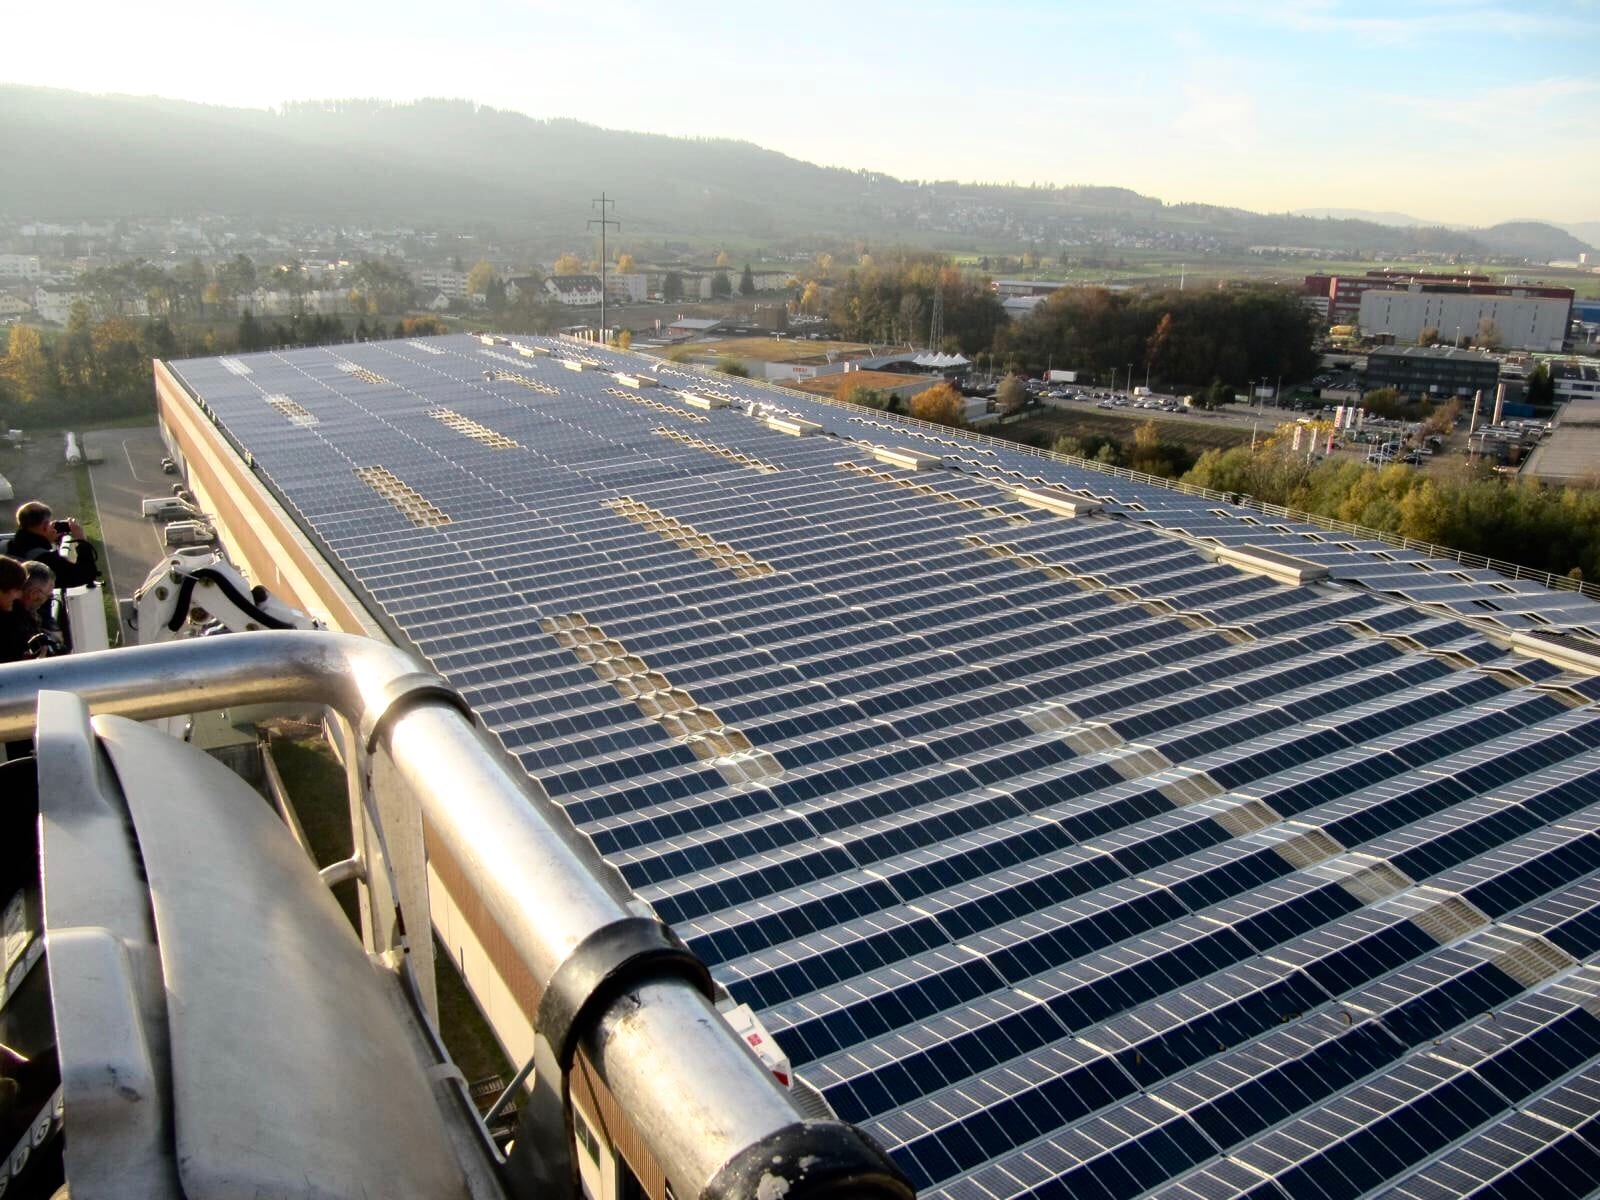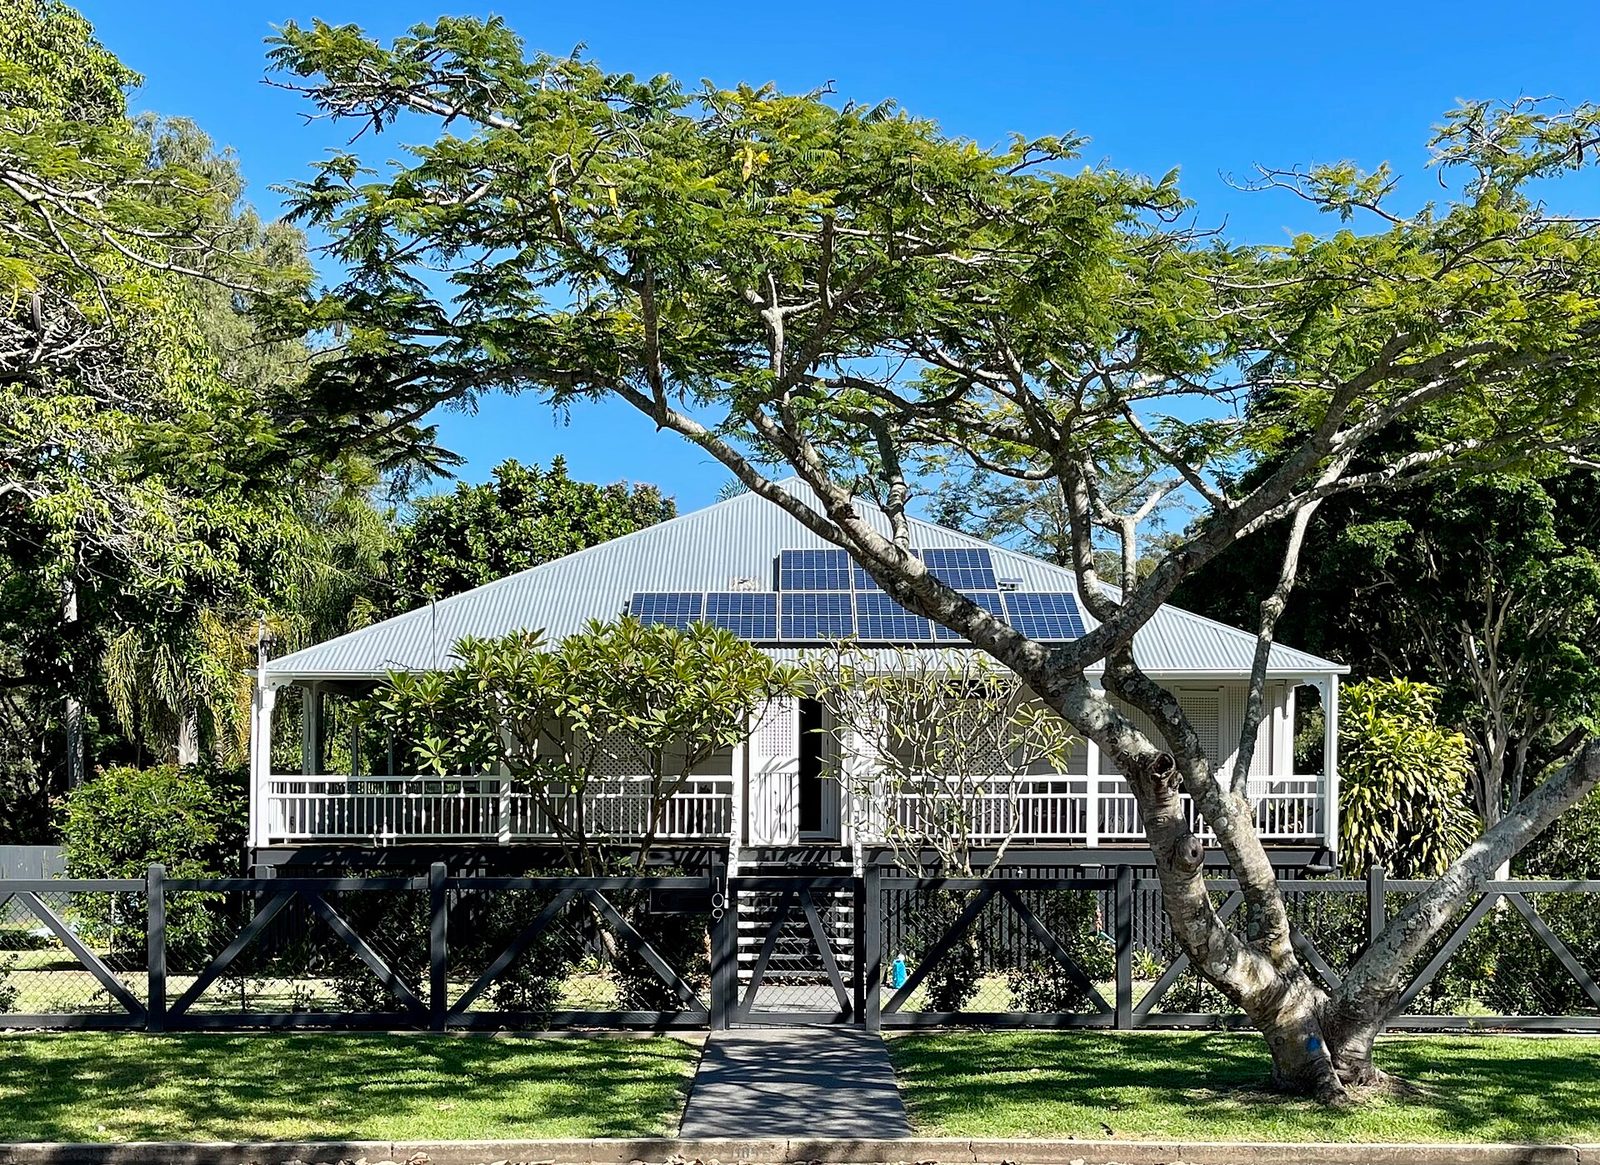

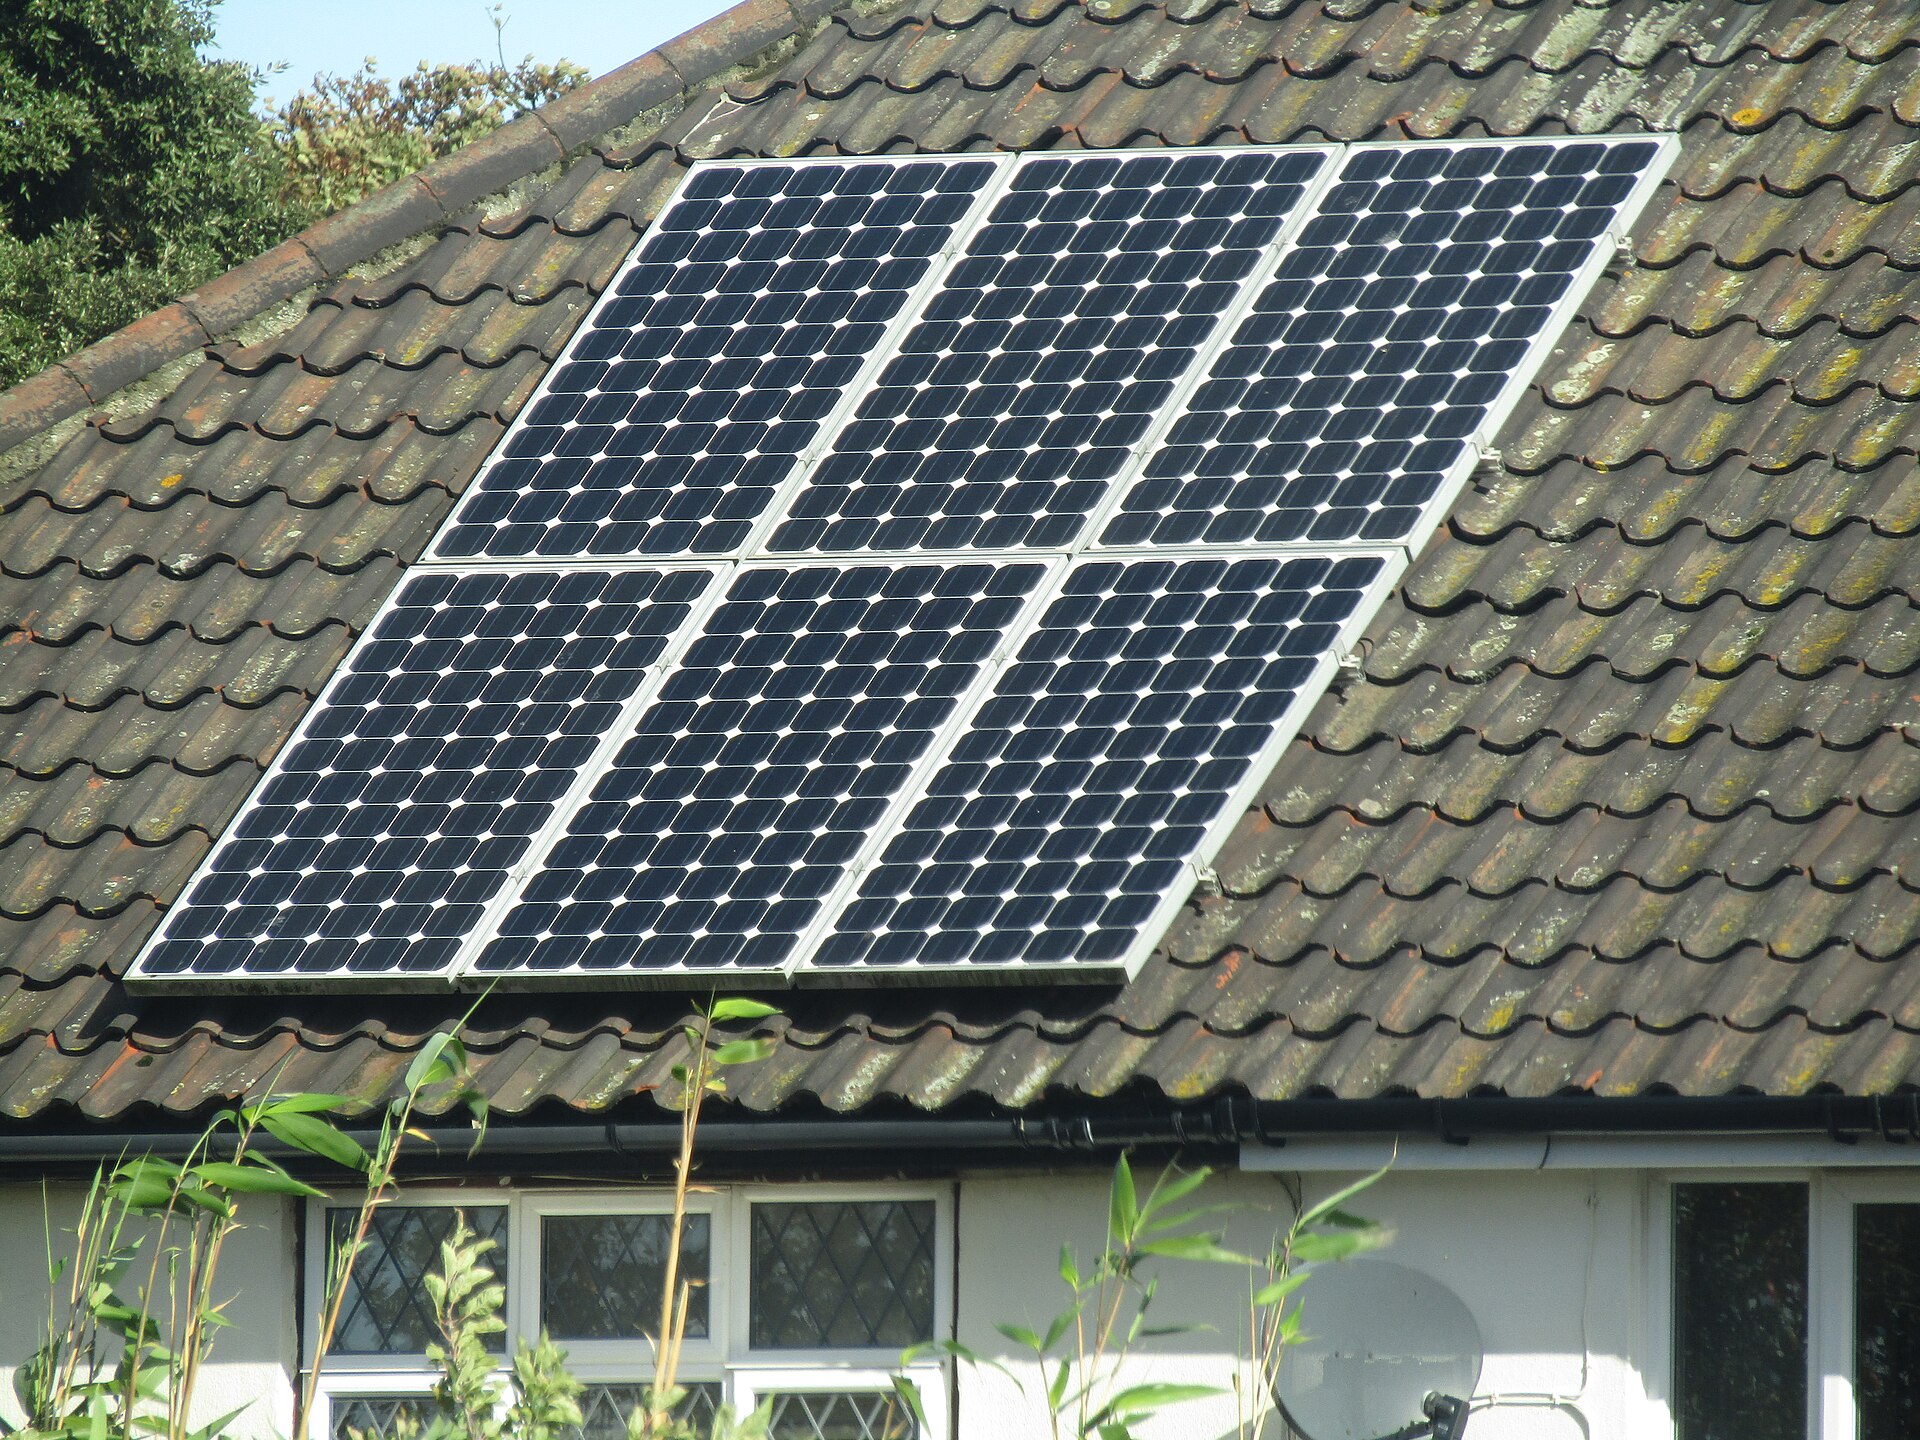
A 5kW solar system in Australia costs A$5,560 on average fully installed as at November 2026, according to the Solar Choice Price Index, and A$4,400 to A$8,470 across the capital cities. That is after the federal STC discount, which is worth about A$1,355 on a typical 5 kW system in 2026. Expect 11 or 12 panels, about 22 to 24 square metres of roof and roughly 16 to 21 kWh a day.
This is independent desk research. Solar Cobber did not request quotes, and no installer paid to be mentioned.
Key facts
- The Solar Choice Price Index for November 2026 puts the average installed price of a 5 kW solar system in Australia at A$5,560 for a standard offer and A$6,580 for a premium offer, including GST and the STC discount.
- The November 2026 Solar Choice standard price for a 5 kW solar system is A$4,400 in Perth, A$5,000 in Sydney, A$5,540 in Brisbane and A$8,470 in Darwin.
- A 5 kW solar system installed in Sydney, Brisbane, Perth, Adelaide or Canberra in 2026 earns 34 small-scale technology certificates (STCs), and 27 if installed in 2027, according to the Clean Energy Regulator formula.
- A 5 kW solar system uses 11 panels at 440 W (4.84 kW) or 12 panels at 440 W (5.28 kW), and needs about 22 to 24 square metres of roof.
- The Clean Energy Regulator’s zone ratings imply a 5 kW solar system produces about 18.9 kWh a day in Sydney, Brisbane, Perth, Adelaide and Canberra, 16.2 kWh in Melbourne and Hobart and 21.0 kWh in Darwin, averaged over a year.
- At 33.1 c/kWh for electricity and 4 c/kWh for exports, Solar Cobber’s calculation gives a simple payback of 4.1 years in Perth to 7.1 years in Darwin when 40 per cent of the output is used at home.
5kW solar system price list (November 2026)
A standard 5 kW solar system costs A$4,400 to A$8,470 depending on the capital, and a premium one A$5,360 to A$9,950. The table shows Solar Choice Price Index averages dated 1 November 2026 (checked 14 November 2026), which include the STC discount and GST. The price per watt and the last column are Solar Cobber calculations.
| Capital city | Standard 5 kW after STCs | Premium 5 kW after STCs | Standard price per watt | STCs in 2026 | Standard before STCs (approx.) |
|---|---|---|---|---|---|
| Perth | A$4,400 | A$5,360 | A$0.88 | 34 | A$5,755 |
| Adelaide | A$4,870 | A$5,940 | A$0.97 | 34 | A$6,225 |
| Sydney | A$5,000 | A$5,910 | A$1.00 | 34 | A$6,355 |
| Melbourne | A$5,120 | A$5,930 | A$1.02 | 29 | A$6,276 |
| Canberra | A$5,170 | A$6,110 | A$1.03 | 34 | A$6,525 |
| Brisbane | A$5,540 | A$6,520 | A$1.11 | 34 | A$6,895 |
| Hobart | A$5,890 | A$6,920 | A$1.18 | 29 | A$7,046 |
| Darwin | A$8,470 | A$9,950 | A$1.69 | 38 | A$9,984 |
| Australia (Solar Choice national) | A$5,560 | A$6,580 | A$1.11 | not applicable | not applicable |
Perth is the cheapest capital and Darwin costs about 92 per cent more than Perth for the same 5 kW. The chart shows the same index.
- Standard offer
- Premium offer
Source: Solar Choice Price Index, data dated 1 November 2026.
View the data as a table
| Standard offer | Premium offer | |
|---|---|---|
| Perth | A$4,400 | A$5,360 |
| Adelaide | A$4,870 | A$5,940 |
| Sydney | A$5,000 | A$5,910 |
| Melbourne | A$5,120 | A$5,930 |
| Canberra | A$5,170 | A$6,110 |
| Brisbane | A$5,540 | A$6,520 |
| Hobart | A$5,890 | A$6,920 |
| Darwin | A$8,470 | A$9,950 |
Perth and Adelaide are the cheapest places to install 5 kW, while Darwin and Hobart cost the most.
SolarQuotes, on its solar panel cost page updated 12 October 2026, reports that buyers paid A$5,000 to A$7,500 for a fully installed 5 kW system. SolarQuotes does not state whether that range is before or after the STC discount, so we do not mix it with the Solar Choice figures. Both are averages, not quotes.
The ABC News In-depth video above explains why solar power has become so cheap, which is the background to the prices in this guide.
What changes the price of a 5kW solar system
Equipment tier moves a 5 kW price most: premium offers in the November 2026 Solar Choice index sit A$810 to A$1,480 above standard ones. Solar Choice estimates mainstream panels at roughly A$0.21 to A$0.28 per watt and premium panels such as REC at A$0.63 to A$0.70 per watt, hardware only (see our solar panel cost guide).
Beyond the panels, a 5 kW quote moves with:
- Inverter type: a string inverter is cheapest, while microinverters or a hybrid inverter that is battery ready cost more.
- Roof: tile roofs, two storeys, several roof faces and long cable runs add labour.
- Switchboard: an old switchboard may need work before solar can connect.
- Location: Darwin and Hobart sit well above the mainland capitals in the index.
How many panels for a 5kW solar system, and how much roof?
A 5 kW solar system needs 11 or 12 panels of 440 W, or 10 panels of 500 W, and about 22 to 24 square metres of roof. The exact kilowatt figure is the panel count multiplied by panel wattage, so installers often quote 4.84 kW or 5.28 kW rather than exactly 5.00.
| Panel size | Panels | Array size (kW) |
|---|---|---|
| 415 W | 12 | 4.98 |
| 440 W | 11 | 4.84 |
| 440 W | 12 | 5.28 |
| 475 W | 11 | 5.23 |
| 500 W | 10 | 5.00 |
Solar Choice says residential panels are commonly 440 to 475 W. The manufacturer datasheets we read in November 2026 list 1.95 to 2.00 square metres for a Jinko Tiger Neo 54HL4, a Trina Vertex S+ and an Aiko Neostar 2P, and 2.08 square metres for a REC Alpha Pure-RX, so 11 or 12 panels take 21 to 25 square metres before gaps and setbacks. Our panel count guide and system sizing guide cover the arithmetic for other sizes.
How much power does a 5kW solar system produce?
A 5 kW solar system produces about 16 to 21 kWh a day on the Clean Energy Regulator’s deemed figures, and 17.5 to 22 kWh a day on the Clean Energy Council’s 2011 guide figures. The Clean Energy Council guide figures come from the 2011 edition of its consumer guide, the most recent per-city table we could open, so treat them as a design-guideline reference, not a recent measurement.
| Capital city | Clean Energy Regulator zone rating (MWh per kW a year) | Deemed 5 kW output (kWh/day) | Clean Energy Council 2011 guide, 5 kW (kWh/day) |
|---|---|---|---|
| Darwin | 1.536 | 21.0 | 22.0 |
| Perth | 1.382 | 18.9 | 22.0 |
| Brisbane | 1.382 | 18.9 | 21.0 |
| Adelaide | 1.382 | 18.9 | 21.0 |
| Canberra | 1.382 | 18.9 | 21.5 |
| Sydney | 1.382 | 18.9 | 19.5 |
| Melbourne | 1.185 | 16.2 | 18.0 |
| Hobart | 1.185 | 16.2 | 17.5 |
The deemed figure is the zone rating multiplied by 5 kW and divided by 365 days (Solar Cobber calculation), and the Clean Energy Council figure is its published 1 kW value multiplied by five. The Clean Energy Regulator publishes its ratings in the postcode zone ratings document, which is dated 1 January 2020, and zones follow postcodes, not cities.
- Regulator deemed output
- Clean Energy Council 2011 guide
Source: Clean Energy Regulator postcode zone ratings (1 January 2020); Clean Energy Council consumer guide, volume 14, August 2011. Solar Cobber calculation: zone rating x 5 kW x 1,000 / 365; Council figure is its 1 kW value x 5.
View the data as a table
| Regulator deemed output | Clean Energy Council 2011 guide | |
|---|---|---|
| Darwin | 21.0 kWh | 22.0 kWh |
| Perth | 18.9 kWh | 22.0 kWh |
| Brisbane | 18.9 kWh | 21.0 kWh |
| Adelaide | 18.9 kWh | 21.0 kWh |
| Canberra | 18.9 kWh | 21.5 kWh |
| Sydney | 18.9 kWh | 19.5 kWh |
| Melbourne | 16.2 kWh | 18.0 kWh |
| Hobart | 16.2 kWh | 17.5 kWh |
Darwin and Perth produce the most from 5 kW and Hobart and Melbourne the least, on both measures.
How output changes by month
Output is much more seasonal in the south than in the north. The Bureau of Meteorology’s mean daily solar exposure, measured per square metre, is the raw sunlight your panels receive.
- Perth
- Brisbane
- Sydney
- Melbourne
- Hobart
Source: Bureau of Meteorology climate statistics (Perth Metro, Brisbane, Sydney Airport, Melbourne Airport, Hobart Airport West), checked 14 November 2026. Solar Cobber calculation: Bureau of Meteorology MJ per square metre divided by 3.6.
View the data as a table
| Perth | Brisbane | Sydney | Melbourne | Hobart | |
|---|---|---|---|---|---|
| Jan | 8.08 | 6.50 | 6.33 | 6.67 | 6.42 |
| Feb | 7.14 | 5.89 | 5.58 | 5.78 | 5.39 |
| Mar | 5.72 | 5.14 | 4.67 | 4.50 | 4.03 |
| Apr | 4.22 | 4.53 | 3.78 | 3.14 | 2.64 |
| May | 3.17 | 3.69 | 2.89 | 2.17 | 1.72 |
| Jun | 2.64 | 3.31 | 2.42 | 1.78 | 1.33 |
| Jul | 2.83 | 3.64 | 2.75 | 2.00 | 1.58 |
| Aug | 3.64 | 4.44 | 3.61 | 2.81 | 2.36 |
| Sep | 4.78 | 5.39 | 4.69 | 3.78 | 3.53 |
| Oct | 6.31 | 5.94 | 5.58 | 4.94 | 4.78 |
| Nov | 7.44 | 6.53 | 6.06 | 5.86 | 5.75 |
| Dec | 8.31 | 6.67 | 6.53 | 6.61 | 6.53 |
December sunshine is 4.9 times June sunshine in Hobart, 3.7 times in Melbourne, 3.1 times in Perth, 2.7 times in Sydney and 2.0 times in Brisbane (Solar Cobber calculation from the Bureau of Meteorology values). A 5 kW system in Melbourne or Hobart makes far less than its annual average in winter, so expect a bigger winter electricity bill there.
How the STC discount applies to a 5kW system
The STC discount on a 5 kW solar system installed in 2026 is 29 to 38 certificates in the capitals, worth about A$1,150 to A$1,515 at A$39.85 each. A small-scale technology certificate (STC) is a tradable certificate created under the federal Small-scale Renewable Energy Scheme, which you assign to your installer in return for an upfront discount.
The Clean Energy Regulator’s formula is system size in kW, multiplied by the postcode zone rating, multiplied by the deeming period, rounded down. The deeming period is 5 years for systems installed in 2026 and 4 years in 2027. The Clean Energy Regulator page does not print the rounding rule, and our existing guides round down, so confirm the exact count with your installer.
| City group | Zone and rating | 2026 STCs (5 years) | 2027 STCs (4 years) | Value in 2026 at A$39.85 |
|---|---|---|---|---|
| Sydney, Brisbane, Perth, Adelaide, Canberra | Zone 3, 1.382 | 34 (34.55) | 27 (27.64) | A$1,355 |
| Melbourne, Hobart | Zone 4, 1.185 | 29 (29.63) | 23 (23.70) | A$1,156 |
| Darwin | Zone 2, 1.536 | 38 (38.40) | 30 (30.72) | A$1,514 |
The certificate price is Demand Manager’s October 2026 range of A$39.85 to A$39.90, and the Clean Energy Regulator’s Clearing House price is capped at A$40 excluding GST. We could not open a November 2026 spot quote. Waiting until 2027 costs a zone 3 buyer 7 certificates, about A$280, and our STC rebate explainer covers eligibility. State schemes differ, so check the state rebate pages for your state.
5kW vs 6.6kW and 10kW: which size makes sense?
A 5 kW solar system costs A$1.11 per watt on the November 2026 Solar Choice national averages, against A$1.06 for 6 kW and A$0.98 for 10 kW, so bigger systems are cheaper per watt. Solar Choice does not publish a 6.6 kW column, so the table uses the sizes it does publish.
| System size | National average after STCs | Price per watt | Extra cost over previous size |
|---|---|---|---|
| 3 kW | A$4,120 | A$1.37 | not applicable |
| 4 kW | A$4,880 | A$1.22 | A$760 |
| 5 kW | A$5,560 | A$1.11 | A$680 |
| 6 kW | A$6,350 | A$1.06 | A$790 |
| 7 kW | A$7,080 | A$1.01 | A$730 |
| 10 kW | A$9,830 | A$0.98 | A$2,750 |
Source: Solar Choice Price Index, data dated 1 November 2026.
View the data as a table
| Installed price | |
|---|---|
| 3 kW | A$4,120 |
| 4 kW | A$4,880 |
| 5 kW | A$5,560 |
| 6 kW | A$6,350 |
| 7 kW | A$7,080 |
| 10 kW | A$9,830 |
Each extra kilowatt up to 7 kW adds A$680 to A$790, which is why most households now choose more than 5 kW.
Solar Cobber calculation: the sixth kilowatt. Moving from 5 kW to 6 kW adds A$790 and, in a zone 3 city, about 1,382 kWh a year (1 kW x 1.382 MWh). If all of that extra output is exported at 4 c/kWh it earns A$55 a year, a 14.3 year payback. If it displaces grid power at 33.1 c/kWh it earns A$457 a year, a 1.7 year payback. The answer depends on whether you are home in the day.
Choose 5 kW if your roof space is tight, your daytime use is low, or your network caps exports. Many networks and retailers treat a 5 kW inverter as a natural limit, as shown in the network table in our 10kW solar system price guide. Choose 6.6 kW or more if you plan a battery or an EV. See is a 6.6kW system right for you, single phase versus three phase and solar and battery package prices.
Is a 5kW solar system worth it? Payback by city
A 5 kW solar system pays for itself in about 4 to 7 years when 40 per cent of its output is used at home, and 7 to 11 years when only 20 per cent is. This is our calculation, built for comparison across cities, so the real figure for your home will differ.
Assumptions: Solar Choice standard November 2026 installed prices; annual output from the Clean Energy Regulator zone rating (5 kW x rating x 1,000 kWh); every kWh used at home replaces electricity at 33.1 c/kWh (the Ausgrid Default Market Offer rate in the Australian Energy Regulator’s 2026-27 determination, as used in our 10kW guide); every exported kWh earns 4 c/kWh (within IPART’s 2026-27 benchmark of 3.4 to 6.5 c/kWh). We applied the same rates to every city so the ranking shows price and sunshine only. Actual tariffs differ by network and retailer, so see the feed-in tariff tracker.
| Capital city | Installed price (standard) | Deemed output (kWh/year) | Annual benefit at 40% self-use | Payback at 40% | Annual benefit at 20% self-use | Payback at 20% |
|---|---|---|---|---|---|---|
| Perth | A$4,400 | 6,910 | A$1,081 | 4.1 years | A$679 | 6.5 years |
| Adelaide | A$4,870 | 6,910 | A$1,081 | 4.5 years | A$679 | 7.2 years |
| Sydney | A$5,000 | 6,910 | A$1,081 | 4.6 years | A$679 | 7.4 years |
| Canberra | A$5,170 | 6,910 | A$1,081 | 4.8 years | A$679 | 7.6 years |
| Brisbane | A$5,540 | 6,910 | A$1,081 | 5.1 years | A$679 | 8.2 years |
| Melbourne | A$5,120 | 5,925 | A$927 | 5.5 years | A$582 | 8.8 years |
| Hobart | A$5,890 | 5,925 | A$927 | 6.4 years | A$582 | 10.1 years |
| Darwin | A$8,470 | 7,680 | A$1,201 | 7.1 years | A$754 | 11.2 years |
The working for Sydney at 40 per cent: 6,910 kWh x 40% = 2,764 kWh used at home x A$0.331 = A$915, plus 4,146 kWh exported x A$0.04 = A$166, giving A$1,081 a year; A$5,000 divided by A$1,081 is 4.6 years.
- 40% used at home
- 20% used at home
Source: Solar Cobber calculation from Solar Choice prices (1 November 2026), Clean Energy Regulator zone ratings and the assumed tariffs stated in the text. Simple payback ignores degradation, tariff changes, finance costs and any state rebate.
View the data as a table
| 40% used at home | 20% used at home | |
|---|---|---|
| Perth | 4.1 years | 6.5 years |
| Adelaide | 4.5 years | 7.2 years |
| Sydney | 4.6 years | 7.4 years |
| Canberra | 4.8 years | 7.6 years |
| Brisbane | 5.1 years | 8.2 years |
| Melbourne | 5.5 years | 8.8 years |
| Hobart | 6.4 years | 10.1 years |
| Darwin | 7.1 years | 11.2 years |
Perth pays back fastest because it has the lowest price and strong sun, while Darwin is slowest because its installed price is so high. Self-use matters more than city: at 20 per cent self-use Sydney’s payback rises from 4.6 to 7.4 years. A home that is empty by day does better with a battery or a timed load such as a heat pump hot water system; see our battery sizing guide.
What to check on your 5kW quote
A sound 5 kW quote states the exact array size, panel and inverter models and the STC count. Check:
- Panel count, wattage and total kW (for example 11 x 440 W = 4.84 kW).
- Inverter model, size and phase, and the export limit the network has approved.
- The number of STCs assigned and the price per certificate behind the discount.
- What is excluded: scaffolding, switchboard work, a Wi-Fi monitoring unit, meter changes.
- The retailer’s listing on the Clean Energy Council approved retailer list (New Energy Tech Consumer Code) and the installer’s on the Solar Accreditation Australia register. Check both yourself.
Star ratings will not separate installers: of the 1,222 rated companies in the Solar Cobber directory, 571 sit at exactly 5.0, as the five-star problem explains. Get three written quotes using how to compare solar quotes, then browse the top 10 solar panel installers and our directory.
FAQ
How much does a 5kW solar system cost in Australia?
A 5 kW solar system costs A$5,560 on average in Australia as at November 2026, after the STC discount, according to the Solar Choice Price Index. City averages run from A$4,400 in Perth to A$8,470 in Darwin.
How many panels do I need for 5kW of solar?
A 5 kW solar system needs 11 or 12 panels of 440 W, which gives 4.84 kW or 5.28 kW, or 10 panels of 500 W. The roof area is about 22 to 24 square metres.
How much does a 5kW solar system produce per day?
A 5 kW solar system produces about 16 to 21 kWh a day on average across the year in the capital cities, based on Clean Energy Regulator zone ratings. Output is higher in summer and lower in winter, and far more seasonal in Melbourne and Hobart than in Brisbane or Darwin.
How many STCs does a 5kW solar system get?
A 5 kW solar system installed in 2026 gets 34 STCs in Sydney, Brisbane, Perth, Adelaide and Canberra, 29 in Melbourne and Hobart and 38 in Darwin. In 2027 the deeming period shortens from 5 years to 4 and the counts fall to 27, 23 and 30.
Is a 5kW solar system enough for a house?
A 5 kW solar system is enough for a small to average home that uses about 15 to 20 kWh a day, mostly in the daytime. Larger homes, electric vehicle owners and households planning a battery usually choose 6.6 kW or more.
Is a 5kW solar system better than 6.6kW?
A 5 kW solar system costs less in total, but a 6.6 kW system costs less per watt and produces more. The extra output only pays well if you use it at home, so 5 kW suits low daytime use or limited roof space.
How long does it take a 5kW solar system to pay for itself?
A 5 kW solar system pays for itself in about 4 to 7 years in the capitals when 40 per cent of output is used at home, according to our simple calculation. It takes 7 to 11 years at 20 per cent self-use.
Can a 5kW solar system run my air conditioner?
A 5 kW solar system can run a typical split system air conditioner in daylight, because the system makes 3 to 5 kW at midday in good sun. It cannot run the air conditioner after dark without a battery.
Sources
- Solar Choice Price Index, November 2026
- SolarQuotes: solar panel cost, updated 12 October 2026
- Clean Energy Regulator: postcode zone ratings and zones for solar systems
- Clean Energy Regulator: calculate STC entitlements
- Clean Energy Regulator: buy and sell STCs
- Demand Manager, Certificate Report October 2026
- Clean Energy Council consumer guide to buying household solar panels, volume 14, August 2011 (copy hosted by Solar Choice)
- Bureau of Meteorology climate statistics, Sydney Airport
- Australian Energy Regulator: Default Market Offer 2026-27
- IPART: solar feed-in tariff benchmark
About this guide
Written by the Solar Cobber editorial team from independent desk research, checked in November 2026. Solar Cobber is a free directory that may earn referral or advertising fees from installers. Commercial relationships never affect our content. Prices are published averages, not quotes, and nothing here is financial advice. Send corrections via /contact.
Filed under Savings
Back to blog