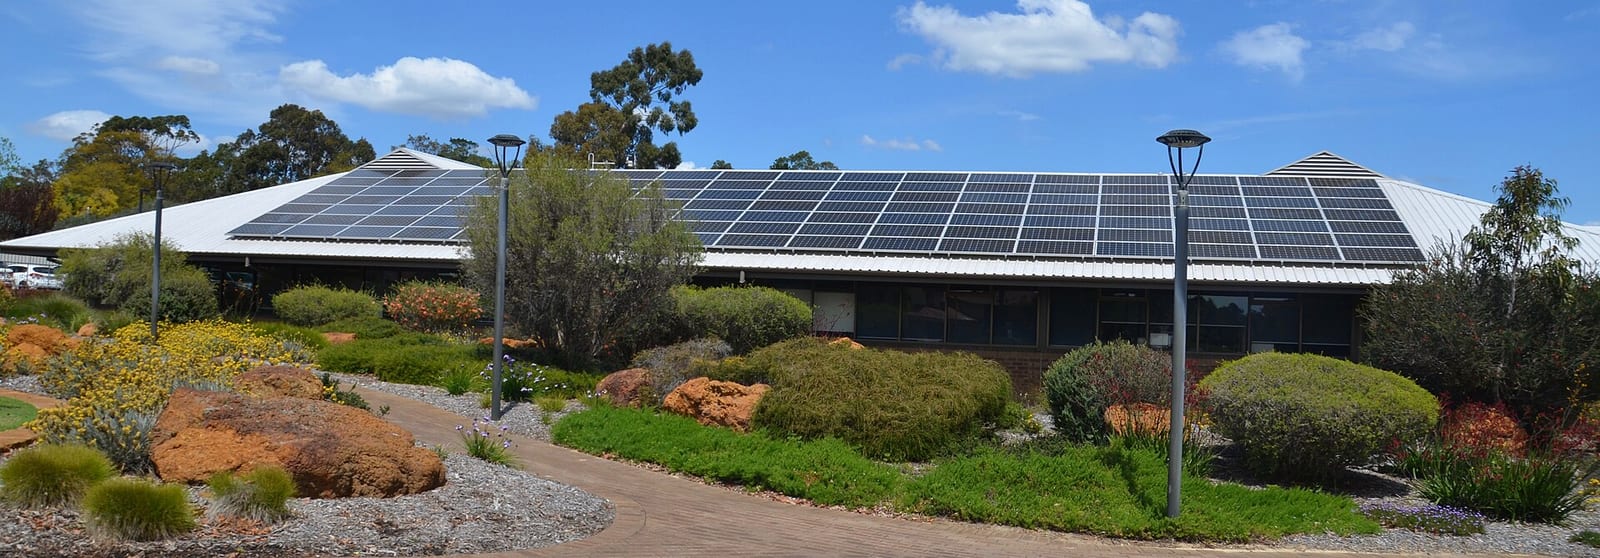

Australia had 4,562,198 small-scale solar systems with a combined 30.9 GW of rated output at 30 September 2026, according to Clean Energy Regulator (CER) postcode data. The average system installed in the second quarter of 2026 was 10.5 kW, and rooftop solar supplied 13.9% of the country’s electricity in 2025 (Clean Energy Council). This page collects the verified numbers, with the date and source beside each one.
Key facts
- The Clean Energy Regulator recorded 4,562,198 small-scale solar PV installations and 30,917,812 kW of rated output in Australia since 2001, to 30 September 2026.
- New South Wales and Queensland each have more than 1.2 million small-scale solar installations as at 30 September 2026, with Queensland on 1,227,952 and New South Wales on 1,200,282.
- The average small-scale solar system installed in Australia in 2024 was 9.89 kW, up from 1.97 kW in 2010, in Solar Cobber’s calculation from Clean Energy Regulator files.
- The Clean Energy Regulator reported an average small-scale solar system size of 10.5 kW in the June quarter of 2026, the fourth quarter in a row above 10 kW.
- The Clean Energy Council estimates rooftop solar produced 13.9% of Australia’s electricity in 2025, against 12.4% in 2024.
- Solar Choice’s November 2026 index puts a standard 6 kW system between A$5,230 (Perth) and A$9,890 (Darwin) fully installed, including the STC discount and GST.
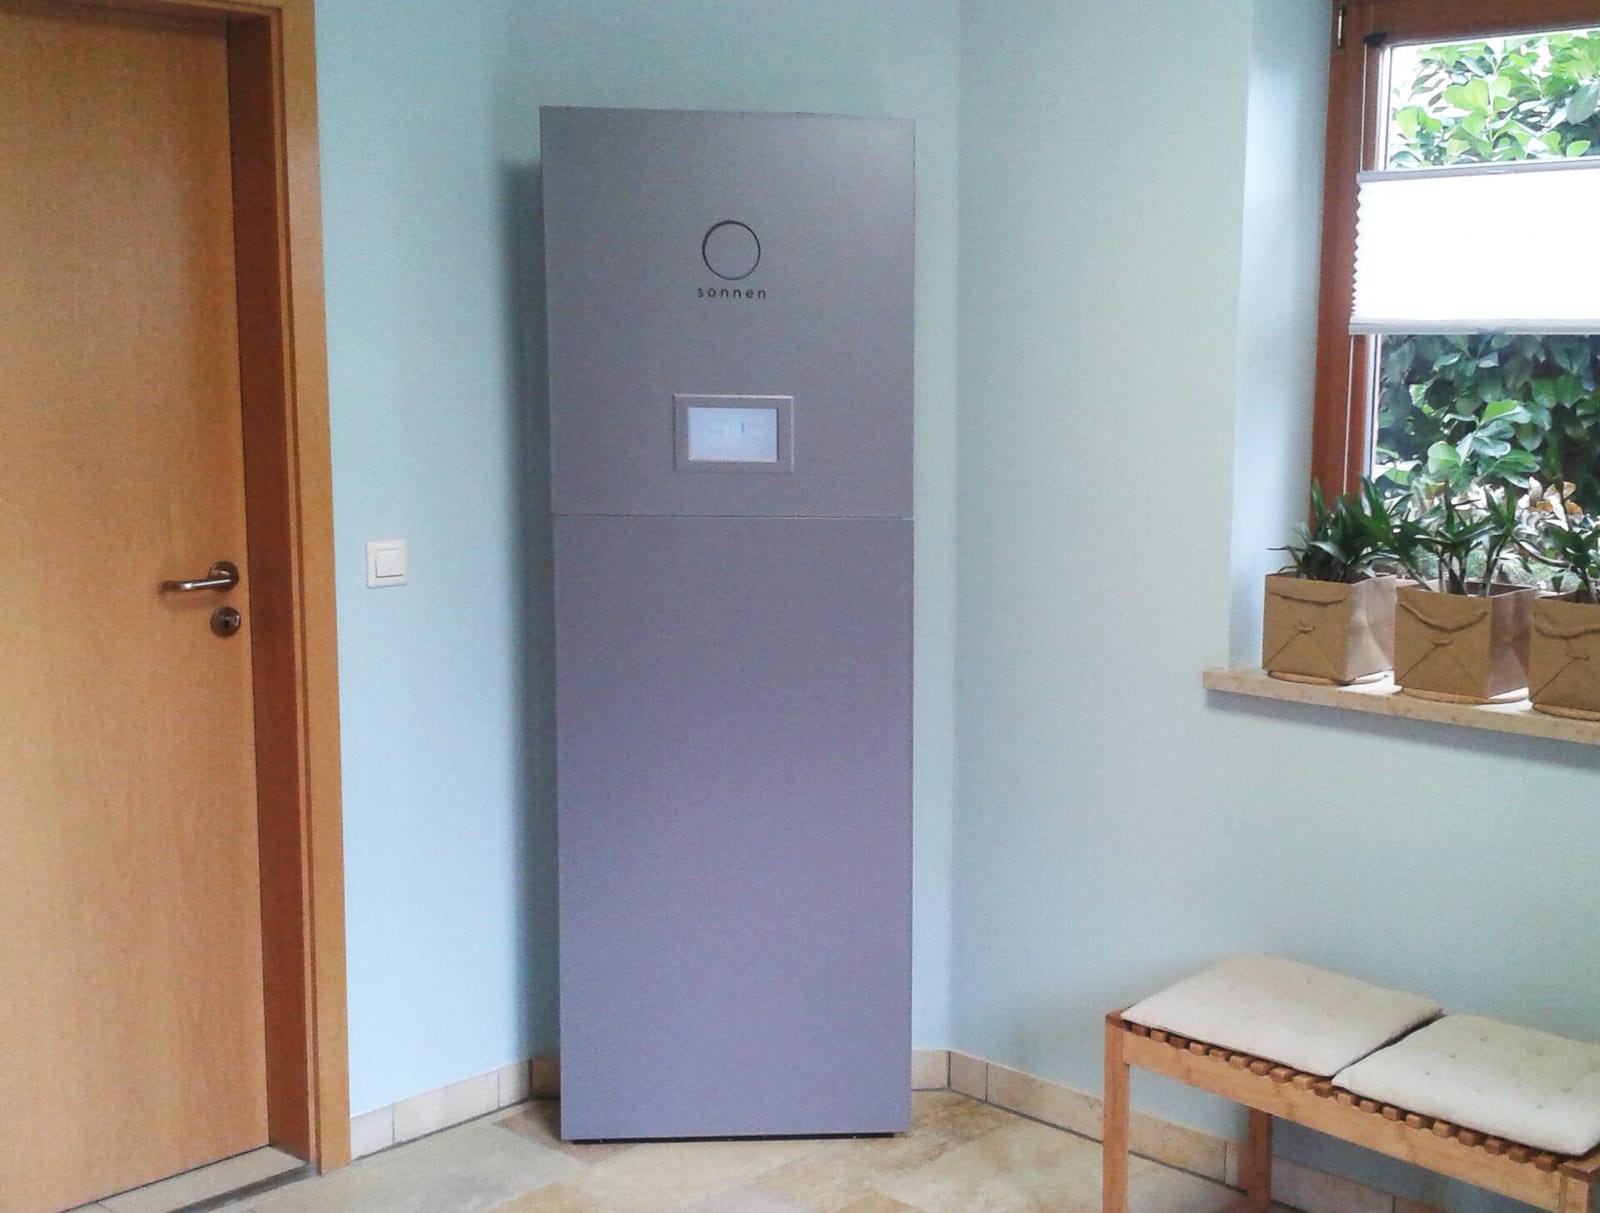
- The Clean Energy Regulator counts 546,789 home batteries installed under the Cheaper Home Batteries Program from 1 July 2025 to 30 September 2026.
How many homes have solar in Australia?
More than 4 million households and small businesses have rooftop solar. The Clean Energy Council puts it at more than 4.3 million households at the end of 2025, and the Australian PV Institute counts over 4.40 million PV installations at 30 June 2026 (its figure includes some commercial systems).
We could not verify a national or state percentage of dwellings with solar from the CER, APVI or the Australian Bureau of Statistics, so we do not publish one. Installations are not the same as households, because a home can have more than one registered system and some systems sit on businesses. The regulator’s numbers below are counts of installations.
How many solar systems are installed each year?
Small-scale solar installations peaked at 377,458 in 2021 and have run at about 320,000 a year since 2022. The CER warns that 2025 and 2026 will keep rising because installers have 12 months to register systems, so the last two columns are “so far”.
Source: Clean Energy Regulator, small-scale installation postcode data, current as at 30 September 2026. 2025 and 2026 are lag-affected; the CER allows a 12-month creation period.
View the data as a table
| Installations | |
|---|---|
| 2011 | 360,745 |
| 2012 | 343,320 |
| 2013 | 200,407 |
| 2014 | 180,139 |
| 2015 | 141,500 |
| 2016 | 132,697 |
| 2017 | 174,942 |
| 2018 | 224,852 |
| 2019 | 284,031 |
| 2020 | 370,320 |
| 2021 | 377,458 |
| 2022 | 315,717 |
| 2023 | 333,865 |
| 2024 | 319,181 |
| 2025 | 272,480 |
| 2026 | 247,233 |
Installations fell from 360,745 in 2011 to 132,697 in 2016, then recovered to above 370,000 in 2020 and 2021.
| Year | Installations | Rated output (kW) | Average system (kW) |
|---|---|---|---|
| 2011 | 360,745 | 872,240 | 2.42 |
| 2016 | 132,697 | 747,923 | 5.64 |
| 2020 | 370,320 | 2,964,706 | 8.01 |
| 2021 | 377,458 | 3,192,517 | 8.46 |
| 2022 | 315,717 | 2,793,532 | 8.85 |
| 2023 | 333,865 | 3,144,986 | 9.42 |
| 2024 | 319,181 | 3,157,264 | 9.89 |
| 2025 (so far) | 272,480 | 2,802,202 | 10.28 |
| 2026 (to 30 Sep) | 247,233 | 2,500,118 | 10.11 |
The table shows installations from the CER, with capacity and average size as Solar Cobber calculations from the CER’s monthly capacity and installation files (capacity divided by installations). For a household, the number of systems matters less than their size: a decade of price falls turned the typical system from a starter kit into a whole-roof installation.
What is the average solar system size in Australia?
The average new small-scale solar system is now above 10 kW, roughly five times the size of the 2010 average. The CER reported 10.5 kW for the June quarter of 2026 and says it is the fourth quarter in a row above 10 kW.
Source: Solar Cobber calculation from Clean Energy Regulator capacity and installation files, current as at 30 September 2026. Annual rated output divided by annual installations.
View the data as a table
| Average system size | |
|---|---|
| 2010 | 1.97 kW |
| 2011 | 2.42 kW |
| 2012 | 3.02 kW |
| 2013 | 3.95 kW |
| 2014 | 4.44 kW |
| 2015 | 4.99 kW |
| 2016 | 5.64 kW |
| 2017 | 6.40 kW |
| 2018 | 7.19 kW |
| 2019 | 7.62 kW |
| 2020 | 8.01 kW |
| 2021 | 8.46 kW |
| 2022 | 8.85 kW |
| 2023 | 9.42 kW |
| 2024 | 9.89 kW |
| 2025 | 10.28 kW |
| 2026 | 10.11 kW |
The average grew every year until 2025. Other publishers use different methods and get slightly different figures, so do not mix them with the line above.
| Source | Measure | Figure |
|---|---|---|
| Clean Energy Regulator, Quarterly Carbon Market Report, June quarter 2026 | Average system, Q2 2026 | 10.5 kW |
| Clean Energy Regulator, same report | Share of Q2 2026 installs of 15 to 40 kW | 26% (16% in Q2 2025) |
| Clean Energy Council, Rooftop Solar and Storage Report, January to June 2026 | Six-month rolling average, June 2026 | 10.45 kW (10.00 kW a year earlier) |
| Clean Energy Council, same report | Record monthly average, December 2025 | 11.35 kW |
| Clean Energy Council, Clean Energy Australia 2026 (IEEFA data) | Average system, 2025 | 10.6 kW |
Batteries are part of the picture: the CER says more than 80% of small-scale solar installations in April 2026 were installed alongside a battery. If you are sizing a system, see what size solar system you need and how many solar panels you need.
Solar installations by state and territory
Queensland and New South Wales lead on cumulative installations, with Victoria third. The CER counts 1,227,952 systems in Queensland and 1,200,282 in New South Wales at 30 September 2026.
View the data as a table
| Installations | |
|---|---|
| Queensland | 1,227,952 |
| New South Wales | 1,200,282 |
| Victoria | 912,235 |
| Western Australia | 589,446 |
| South Australia | 468,663 |
| ACT | 69,139 |
| Tasmania | 68,389 |
| Northern Territory | 26,092 |
The three biggest markets hold 73% of Australian systems.
| State | Cumulative installs | 2024 | 2025 (so far) | 2026 (to 30 Sep) | Cumulative rated output (kW) | Average per system (kW) |
|---|---|---|---|---|---|---|
| NSW | 1,200,282 | 97,814 | 75,809 | 69,830 | 8,761,808 | 7.30 |
| QLD | 1,227,952 | 81,549 | 69,653 | 67,297 | 8,318,619 | 6.77 |
| VIC | 912,235 | 67,343 | 62,282 | 48,231 | 6,090,521 | 6.68 |
| WA | 589,446 | 35,593 | 30,291 | 31,004 | 3,411,360 | 5.79 |
| SA | 468,663 | 25,759 | 23,719 | 22,154 | 3,115,805 | 6.65 |
| ACT | 69,139 | 4,770 | 4,420 | 3,910 | 548,071 | 7.93 |
| TAS | 68,389 | 5,283 | 5,212 | 3,981 | 441,927 | 6.46 |
| NT | 26,092 | 1,070 | 1,094 | 826 | 229,698 | 8.80 |
| Australia | 4,562,198 | 319,181 | 272,480 | 247,233 | 30,917,813 | 6.78 |
Installations and yearly counts are from CER Table 5. Cumulative output by state and the average per system are Solar Cobber calculations (postcodes mapped to states by Australia Post ranges, so a handful of border postcodes may be misallocated; average per system is cumulative output divided by cumulative installs). The averages are lower than the 2024 and 2025 annual averages because they include many years of smaller systems. Western Australia is the one large market where 2026 installs to September (31,004) are already ahead of all of 2025 so far (30,291), though both figures will rise.
The top postcode in each state by installations, to the end of 2025 (Clean Energy Council, Clean Energy Australia 2026): Hoppers Crossing 3029 in Victoria (26,575), Bundaberg 4670 in Queensland (24,110), Mandurah 6210 in Western Australia (22,103), Riverstone 2765 in New South Wales (14,647), Salisbury 5108 in South Australia (9,373), Charnwood 2615 in the ACT (8,707), Launceston 7250 in Tasmania (5,472) and Alawa 0810 in the Northern Territory (4,344). On the CER’s count to 30 September 2026, the top three postcodes are 3029 (28,370), 4670 (24,947) and 4655 (23,811).
How much of Australia’s electricity comes from solar?
Rooftop solar supplied 13.9% of Australia’s electricity in 2025, and utility-scale solar 7.7%, in the Clean Energy Council’s national generation mix.
- Rooftop solar
- Utility-scale solar
Source: Clean Energy Council, Clean Energy Australia 2024, 2025 and 2026 (generation mix tables).
View the data as a table
| Rooftop solar | Utility-scale solar | |
|---|---|---|
| 2023 | 11.2% | 7.0% |
| 2024 | 12.4% | 7.2% |
| 2025 | 13.9% | 7.7% |
Rooftop solar’s share rose 2.7 percentage points in two years, while utility-scale solar rose 0.7 points, so households are doing most of the work. Together the two supplied 21.6% of national generation in 2025 (Solar Cobber addition: 13.9 plus 7.7).
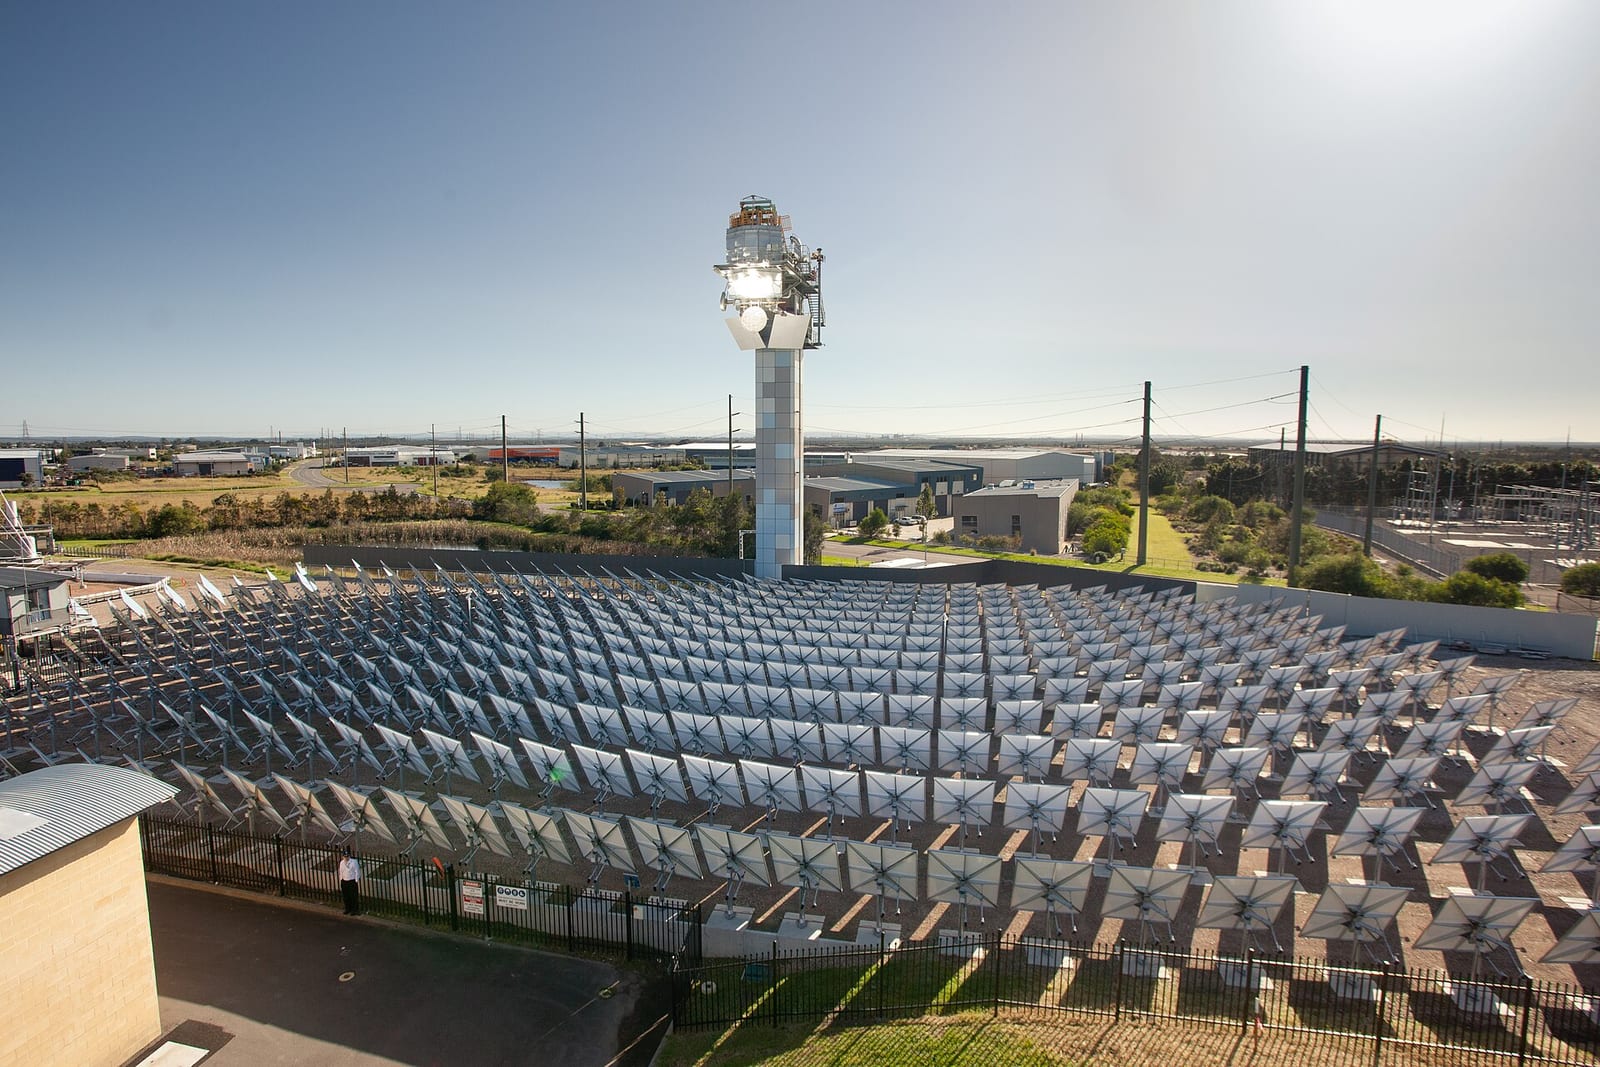
Do not compare these national shares with grid-only figures. For the National Electricity Market alone, the Australian Energy Market Operator (AEMO) reported by pv magazine put distributed solar at 10.3% of the mix in the second quarter of 2026, which is a quarter of winter and not a full year. The Clean Energy Council also credits Open Electricity with a 12.9% rooftop share for the first half of 2026. The Clean Energy Council reports 2.0 GW of utility solar commissioned in 2025. For the farms themselves, see solar farms in Australia.
How much does a solar system cost in Australia?
A standard 6 kW system costs between A$5,230 and A$9,890 fully installed in November 2026, depending on the city. Solar Choice puts the national average at A$0.88 to A$0.95 per watt, including GST and the STC discount.
Source: Solar Choice Solar Panel Price Index, data dated 1 November 2026.
View the data as a table
| 6 kW system | |
|---|---|
| Darwin | A$9,890 |
| Hobart | A$6,680 |
| Brisbane | A$6,200 |
| Sydney | A$5,800 |
| Canberra | A$5,790 |
| Melbourne | A$5,750 |
| Adelaide | A$5,470 |
| Perth | A$5,230 |
Perth is the cheapest of the eight capitals and Darwin costs about 89% more (A$9,890 against A$5,230, a Solar Cobber calculation). The table gives the other sizes.
| City | 5 kW | 6 kW | 7 kW | 10 kW |
|---|---|---|---|---|
| Adelaide | A$4,870 | A$5,470 | A$6,340 | A$8,610 |
| Brisbane | A$5,540 | A$6,200 | A$7,080 | A$9,350 |
| Canberra | A$5,170 | A$5,790 | A$6,560 | A$8,580 |
| Darwin | A$8,470 | A$9,890 | A$10,490 | A$14,930 |
| Hobart | A$5,890 | A$6,680 | A$7,500 | A$11,080 |
| Melbourne | A$5,120 | A$5,750 | A$6,450 | A$8,870 |
| Perth | A$4,400 | A$5,230 | A$5,670 | A$8,410 |
| Sydney | A$5,000 | A$5,800 | A$6,510 | A$8,810 |
| National average | A$5,560 | A$6,350 | A$7,080 | A$9,830 |
Source: Solar Choice Solar Panel Price Index, standard offers, data dated 1 November 2026. SolarQuotes’ page (updated 12 October 2026) gives different and wider buyer-reported ranges: A$5,000 to A$7,500 for 5 kW, A$6,000 to A$9,000 for 6.6 kW and about A$9,000 to A$12,000 for 10 kW. SolarQuotes does not state whether those include the STC discount, so we do not mix the two. Solar Choice does not publish a year-by-year price history in a form we could read, so we do not chart one. For detail, see solar panel cost in Australia and the 10 kW solar system price guide.
The STC discount shrinks every year. The deeming period, the number of years of output the discount covers, is 5 in 2026 and 4 in 2027 (Clean Energy Regulator, updated 29 October 2026). In Solar Cobber’s calculation, a 6.6 kW system in a zone 3 city such as Sydney earns 45 certificates in 2026 and 36 in 2027, using 6.6 kW x 1.382 x years, rounded down. Our STC explainer shows the full working.
How much power does a solar panel make in each city?
A solar panel in Darwin sees about 5.94 kWh of sunshine per square metre a day over the year, against 3.83 kWh in Hobart. These are Bureau of Meteorology (BoM) mean daily solar exposure averages, from the stations’ published tables (1990 to 2026 for most; Canberra 2007 to 2026), converted from MJ per square metre by dividing by 3.6.
Source: Bureau of Meteorology climate averages (Darwin Airport, Perth Metro, Brisbane, Adelaide Airport, Canberra Airport, Sydney Airport, Melbourne Airport, Hobart Airport West), checked 14 November 2026. Solar Cobber calculation: BoM MJ per square metre divided by 3.6.
View the data as a table
| Solar exposure | |
|---|---|
| Darwin | 5.94 kWh/m2 |
| Perth | 5.36 kWh/m2 |
| Brisbane | 5.14 kWh/m2 |
| Adelaide | 4.92 kWh/m2 |
| Canberra | 4.67 kWh/m2 |
| Sydney | 4.58 kWh/m2 |
| Melbourne | 4.17 kWh/m2 |
| Hobart | 3.83 kWh/m2 |
Seasons matter as much as cities. Perth gets 8.31 kWh per square metre on an average December day and 2.64 in June, while Hobart gets 6.53 in December and 1.33 in June (BoM, same stations). Output follows, which is why winter bills hurt in the south.
What it means for your solar or battery decision
Statistics describe the market, but a quote should be judged against your own roof, tariff and usage. Three points follow from the data above.
- A bigger system is now normal. If an installer proposes a 6.6 kW system for a family home, check whether 10 kW costs only a little more per watt. Compare against is solar worth it in Australia.
- Location changes price and output. Darwin and Hobart buyers pay more per system; Perth and Adelaide buyers pay less.
- Batteries are now part of the solar decision. The CER counts 546,789 batteries installed since 1 July 2025, and the Clean Energy Council reports 153 batteries for every 100 rooftop solar installations in the first half of 2026. See home battery statistics in Australia and the Cheaper Home Batteries Program guide.
To compare local installers, use our directory of solar companies or the top 10 solar installers. State rebates differ, so check the page for Victoria, New South Wales, Queensland or Western Australia.
Installers per solar system: a Solar Cobber cut
Our directory lists 1,611 solar companies (queried 2 August 2026). Dividing the rated companies that serve each state by that state’s cumulative solar installs (CER, to 30 September 2026) gives a rough guide to how many listed installers compete for local buyers.
| State | Listed rated companies serving it | Cumulative installs | Companies per 10,000 installs |
|---|---|---|---|
| Victoria | 283 | 912,235 | 3.10 |
| Tasmania | 19 | 68,389 | 2.78 |
| New South Wales | 332 | 1,200,282 | 2.77 |
| Western Australia | 158 | 589,446 | 2.68 |
| South Australia | 110 | 468,663 | 2.35 |
| Queensland | 188 | 1,227,952 | 1.53 |
This is a directory sample and not a count of all businesses. A company serving several states appears in each, and we leave out the ACT (38 companies) and the Northern Territory (30) because their small installation bases make the ratio unreliable. Queensland has the fewest listed companies per installed system. The wider results are in the Australian Solar Installer Report 2026.
The video above is an ABC News In-depth report on how solar power became cheap.
How this has changed
Since 2010 the number of systems a year has swung between 132,697 and 377,458, while average size has grown from 1.97 kW to above 10 kW. Rated output reached 3,192,517 kW in 2021. Clean Energy Council figures show 273,672 installations and 2,800 MW in 2025, and 180,878 systems and 1,894 MW in the first half of 2026 (134,013 and 1,339 MW in the first half of 2025).
Method and sources
- Installations, capacity and state counts: Clean Energy Regulator small-scale installation postcode data, current as at 30 September 2026 (page updated 20 October 2026). Annual rated output and average size are Solar Cobber calculations from the CER monthly capacity and installation CSV files. A CER page typo (277,233 for 2026 in Table 5) was corrected to 247,233, which matches the file and Table 1.
- Lag: the CER notes that figures for the current and previous year keep rising during the 12-month creation period.
- Generation share: Clean Energy Council, Clean Energy Australia reports for 2023, 2024 and 2025. The 2021 and 2022 shares were not verified, so the chart starts in 2023.
- Prices: Solar Choice Solar Panel Price Index (data dated 1 November 2026) and SolarQuotes (12 October 2026), attributed by name.
- Sunshine: BoM climate averages tables, checked 14 November 2026, divided by 3.6 (Solar Cobber calculation).
- Not published here: a dwelling-share percentage and a price-per-watt history, because we could not verify them at source.
FAQ
How many homes have solar in Australia?
More than 4 million households and small businesses have rooftop solar. The Clean Energy Council puts it at more than 4.3 million households at the end of 2025, and the CER counts 4,562,198 small-scale solar installations to 30 September 2026.
What is the average solar system size in Australia?
The average new small-scale system was 10.5 kW in the June quarter of 2026 (Clean Energy Regulator). In calendar 2024 it was 9.89 kW on our calculation from CER files.
Which state has the most rooftop solar?
Queensland has the most installations (1,227,952), just ahead of New South Wales (1,200,282), at 30 September 2026. New South Wales has more installed capacity (8,761,808 kW against 8,318,619 kW for Queensland, our calculation).
How much of Australia’s electricity comes from rooftop solar?
Rooftop solar supplied 13.9% of Australian electricity in 2025, according to the Clean Energy Council. Utility-scale solar added 7.7%.
How many solar systems are installed in Australia each year?
About 320,000 a year since 2022 on the CER’s data: 315,717 in 2022, 333,865 in 2023 and 319,181 in 2024. The 2025 figure of 272,480 and the 2026 figure of 247,233 to 30 September are still rising.
What does a 6 kW solar system cost in Australia?
A standard 6 kW system costs between A$5,230 (Perth) and A$9,890 (Darwin) in November 2026, with a national average of A$6,350, according to Solar Choice. All include GST and the STC discount.
Where is solar strongest in Australia?
Darwin has the highest average solar exposure of the eight capitals at 5.94 kWh per square metre per day, then Perth at 5.36 (BoM averages). Hobart is lowest at 3.83.
What is the most popular solar postcode?
Hoppers Crossing (3029) in Victoria, with 28,370 installations to 30 September 2026 in the CER data and 26,575 to the end of 2025 in the Clean Energy Council report.
Sources
- Clean Energy Regulator: small-scale installation postcode data
- Clean Energy Regulator: Quarterly Carbon Market Report, June quarter 2026, consumer energy resources
- Clean Energy Council: Clean Energy Australia 2026
- Clean Energy Council: Rooftop Solar and Storage Report, January to June 2026
- Australian PV Institute: analyses
- Solar Choice: solar panel price index
- SolarQuotes: solar panel cost
- Bureau of Meteorology: climate averages, Sydney Airport
- Clean Energy Regulator: calculate small-scale technology certificate entitlements
About this guide
This guide was written by the Solar Cobber editorial team from independent desk research checked in November 2026. Solar Cobber is a free directory that may earn referral or advertising fees from installers, but commercial relationships never affect our content. It is general information, not financial advice. To report a correction, please contact us.
Filed under Solar Guides
Back to blog