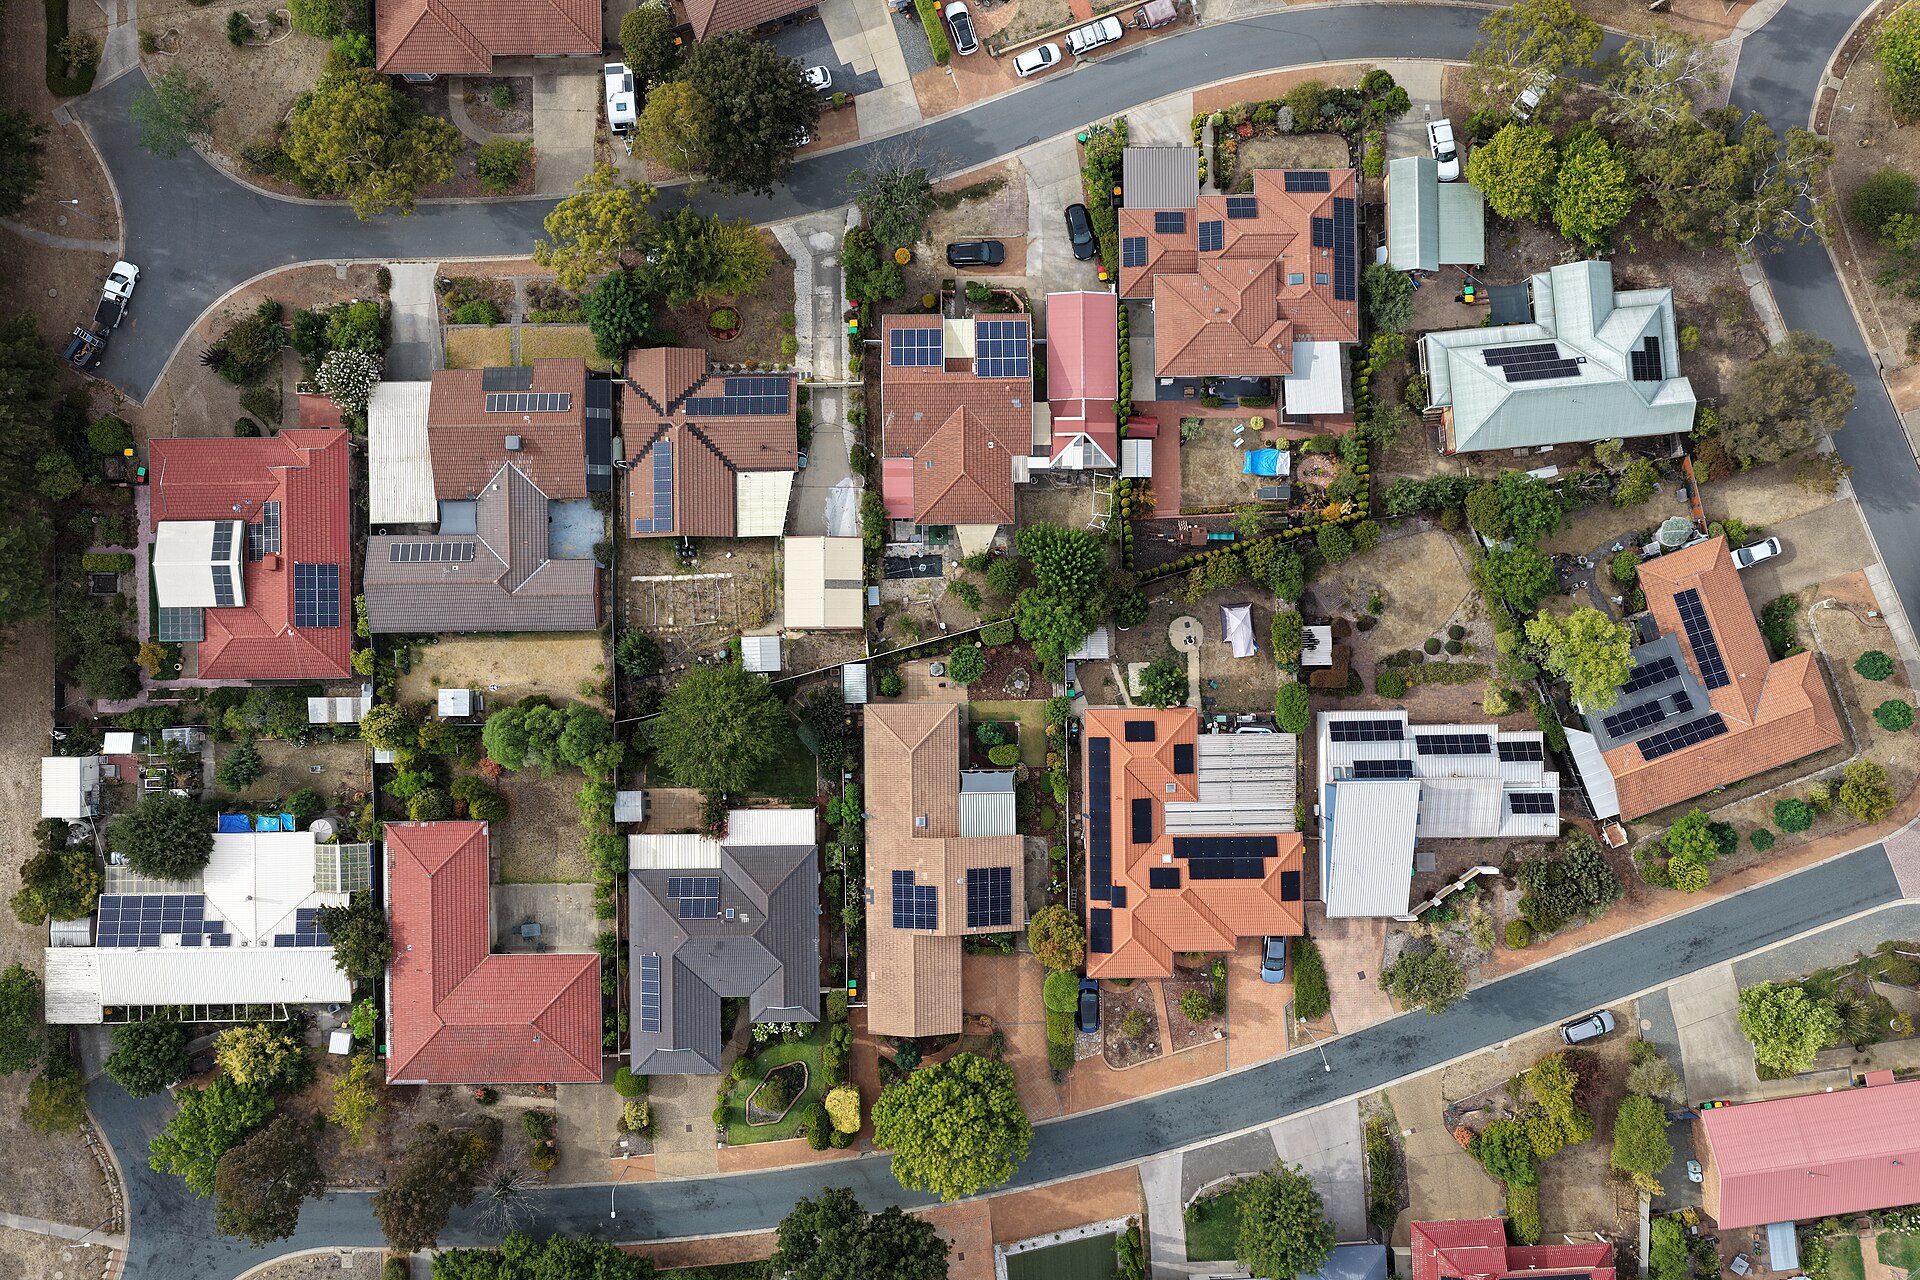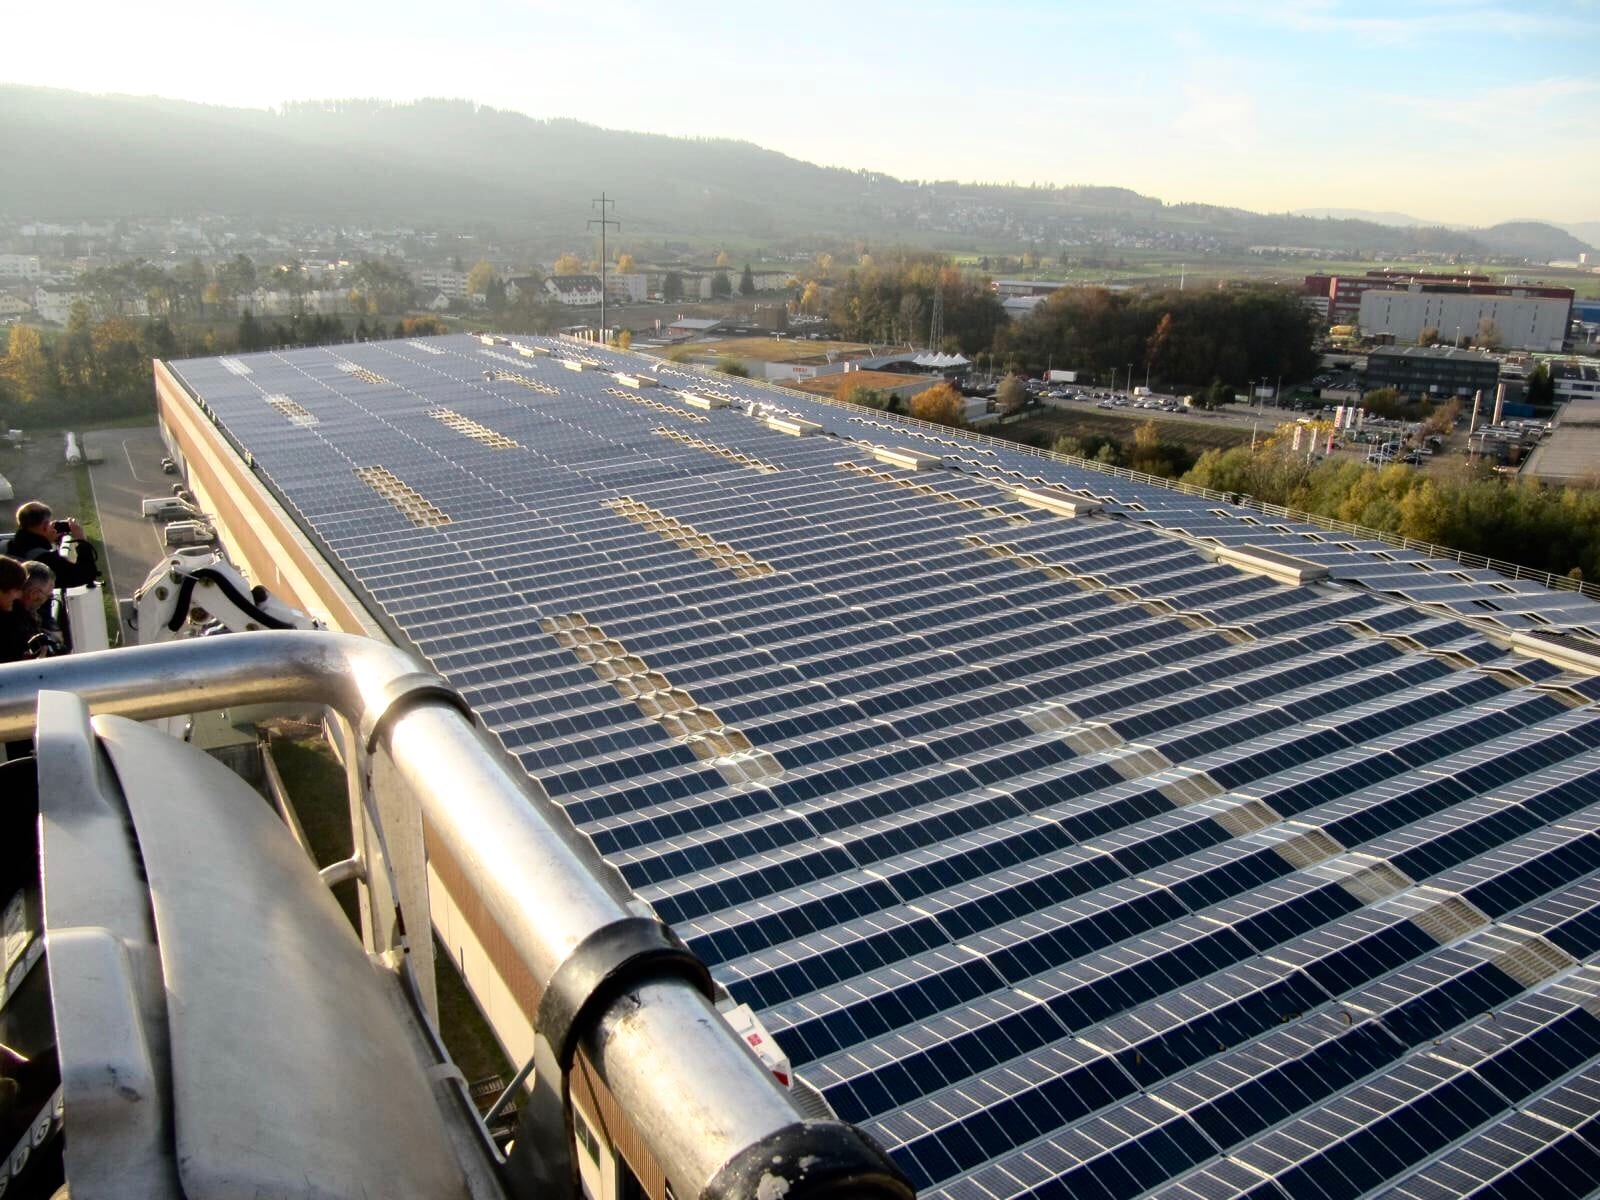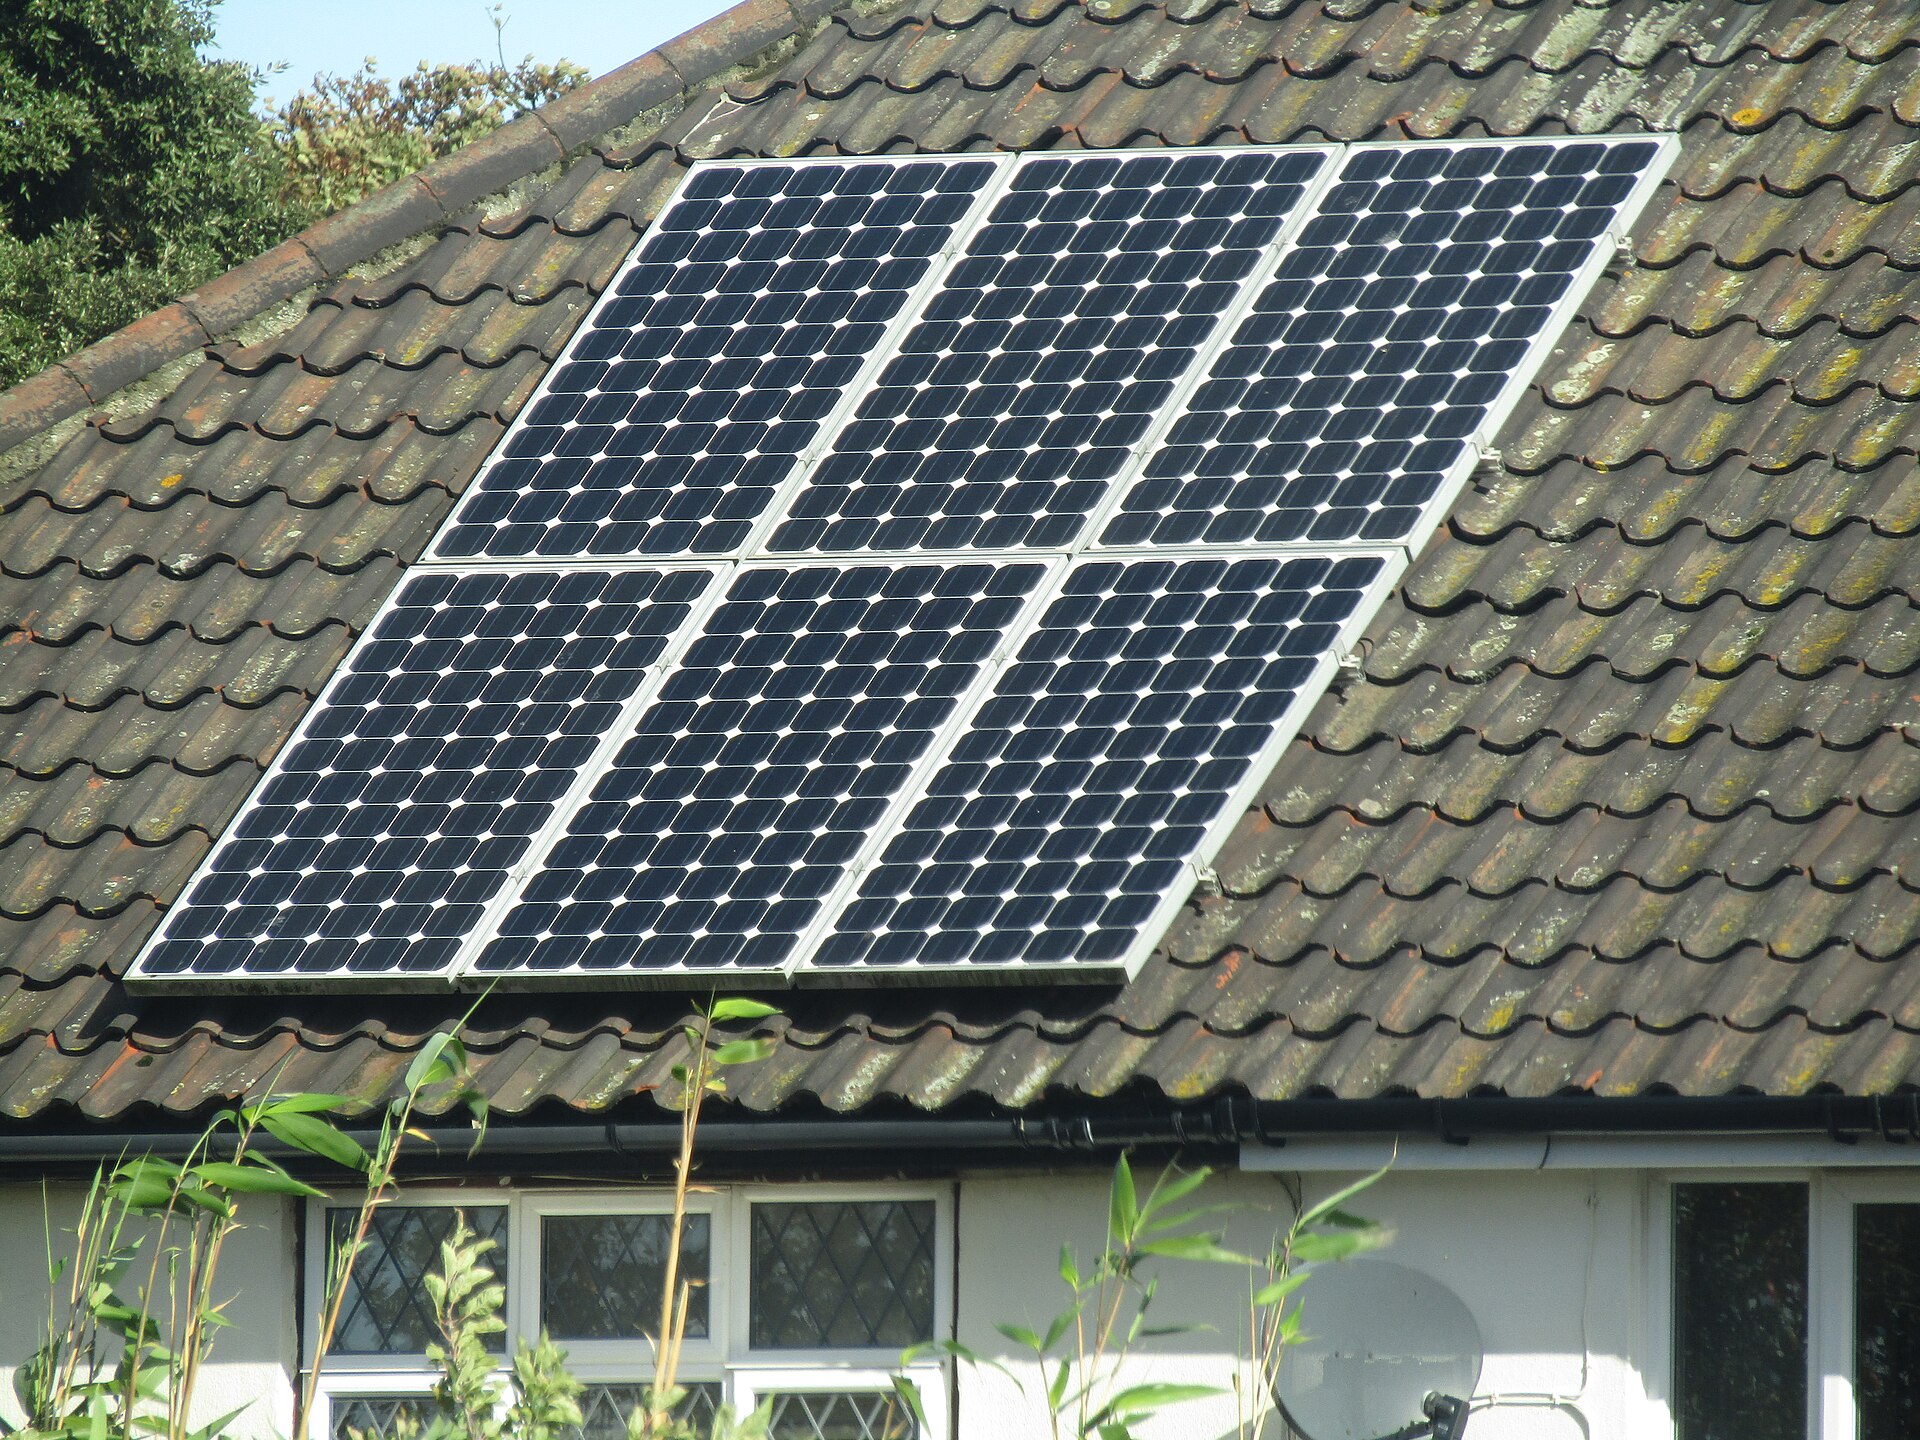

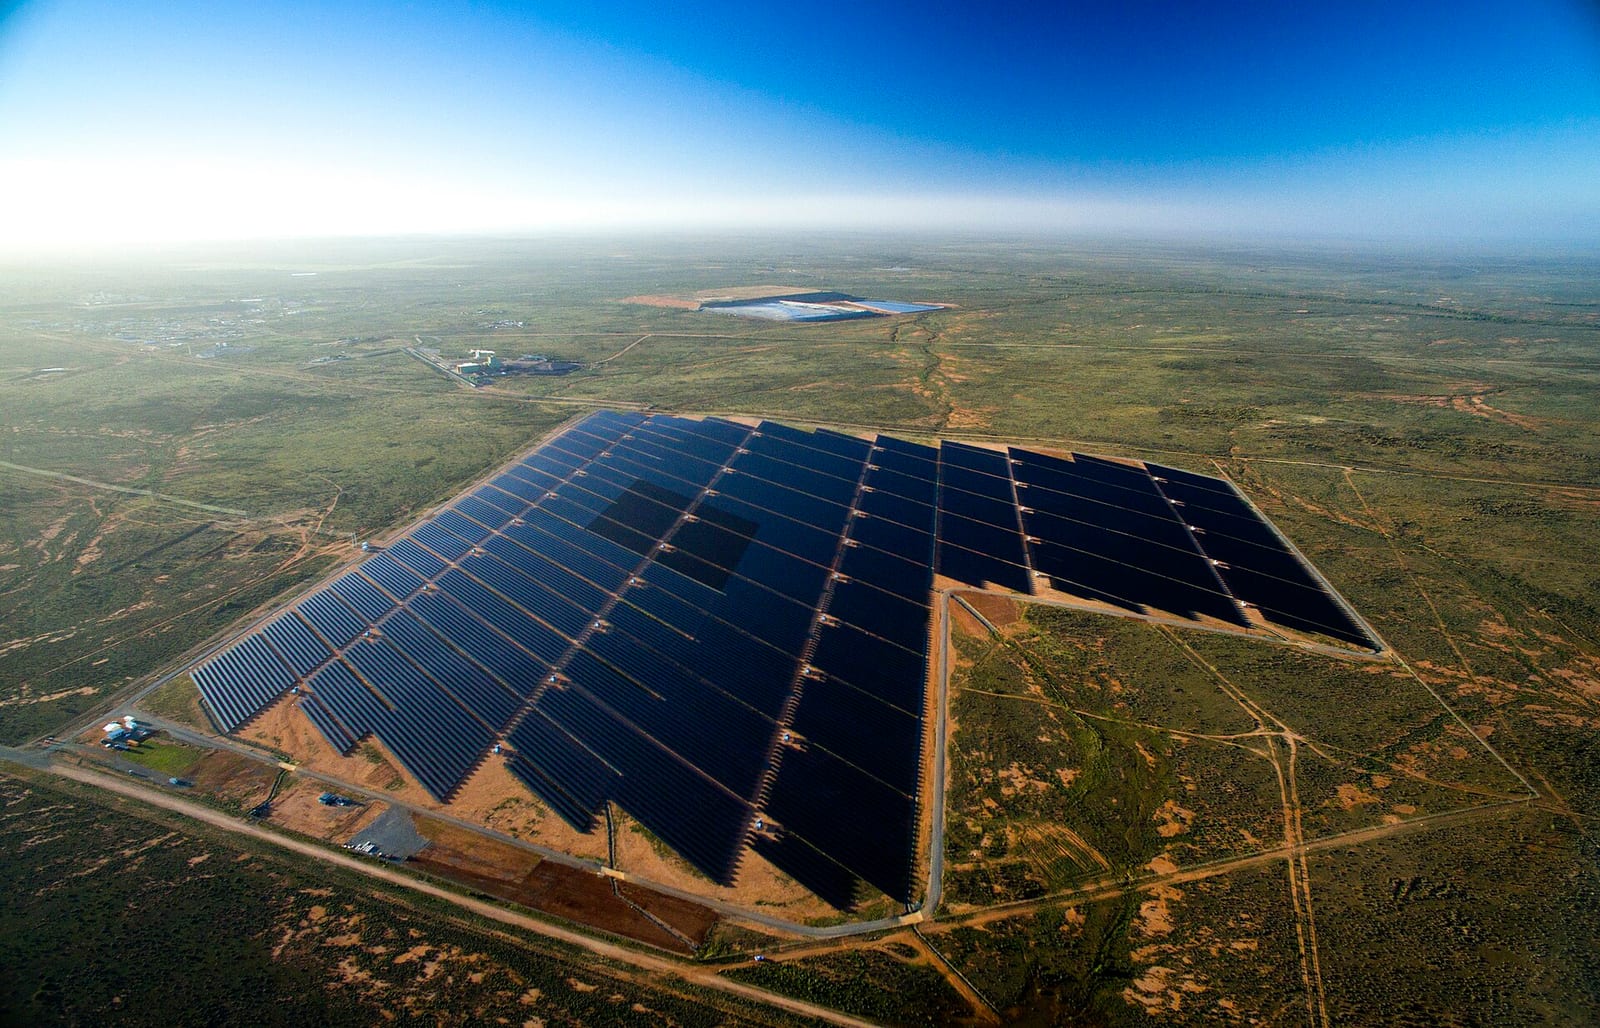
A solar farm is a large ground-mounted solar power station that sells electricity into the grid. In 2025 utility-scale solar farms supplied 7.7% of Australia’s electricity, and 18 projects totalling 2.0 GW were commissioned, according to the Clean Energy Council. As at December 2025 the largest operating farms are 400 MW: Western Downs Green Power Hub (Queensland), New England Solar Stage 1 and Stubbo (both New South Wales).
Key facts
- Utility-scale solar farms produced 7.7% of Australia’s electricity in 2025, against 13.9% from rooftop solar, according to the Clean Energy Council’s Clean Energy Australia 2026 report.
- The Clean Energy Council counted 18 utility-scale solar projects totalling 2.0 GW commissioned in Australia in 2025, an average of about 111 MW each (Solar Cobber calculation).
- Three solar farms share the top spot at 400 MW each as at December 2025: Western Downs Green Power Hub (Neoen), New England Solar Stage 1 (ACEN Australia) and Stubbo Solar Farm (ACEN Australia).
- Grid-scale solar supplied 7.6% of National Electricity Market generation in the June quarter of 2026, with average output of 1,860 MW, as reported by pv magazine Australia from AEMO data.
- Large solar and wind units in the National Electricity Market lost 7.2 TWh to curtailment in 2025, up from 4.3 TWh in 2024, according to WattClarity data reported by pv magazine Australia in February 2026.
- We could not verify a current total of operating utility-scale solar capacity, so this guide does not state one.
How do solar farms work?
A solar farm turns sunlight into direct current in thousands of panels, converts it to alternating current in inverters, and steps the voltage up through a transformer to feed the high-voltage grid. Many farms mount panels on single-axis trackers that rotate to follow the sun. New England Solar in New South Wales, for example, is described by its owner ACEN Australia as a 2,000 hectare site with over 1.5 million panels on single-axis trackers once complete (page checked November 2026).
Capacity is quoted two ways. MWac is what the inverters can send to the grid, and MWp or MWdc is the panel rating, usually larger. Culcairn Solar Farm in NSW, for instance, is listed by its owner Neoen at 440 MWp (DC) and has operated since March 2026. The Clean Energy Council’s top five list does not state its basis, so compare farms only on the same basis.
What is the largest solar farm in Australia?
Three farms tie for largest at 400 MW, and Queensland and New South Wales hold all five of the top places. The table is the Clean Energy Council’s top five by capacity, data correct as of December 2025.
| Rank | Solar farm | State | Capacity (MW) | Owner | Fully operational |
|---|---|---|---|---|---|
| 1= | Western Downs Green Power Hub | QLD | 400 | Neoen Australia | 2023 |
| 1= | New England Solar Stage 1 | NSW | 400 | ACEN Australia | 2023 |
| 1= | Stubbo Solar Farm | NSW | 400 | ACEN Australia | 2025 |
| 4 | Aldoga Solar Farm | QLD | 380 | ACCIONA Energia | 2025 |
| 5 | Walla Walla Solar Farm | NSW | 300 | FRV Australia | 2025 |
Source: Clean Energy Council, Clean Energy Australia 2026, data correct as of December 2025.
View the data as a table
| Capacity | |
|---|---|
| Western Downs Green Power Hub (QLD) | 400 MW |
| New England Solar Stage 1 (NSW) | 400 MW |
| Stubbo Solar Farm (NSW) | 400 MW |
| Aldoga Solar Farm (QLD) | 380 MW |
| Walla Walla Solar Farm (NSW) | 300 MW |
Three farms are tied at 400 MW and all five are in Queensland or New South Wales. Three of the five reached full operation in 2025.
Three notes on this list. The Clean Energy Council ranks only the top five, and we could not confirm a verified ranking of farms six to ten, so we do not publish one. New England Solar is described by ACEN as up to 720 MW including battery storage built in stages, with a 200 MW battery in final commissioning. Culcairn (440 MWp, Neoen) is not on the list because it began operating in March 2026, after the data date.
How much electricity do solar farms generate?
Utility-scale solar produced 7.7% of Australia’s electricity in 2025, making it a smaller contributor than rooftop solar at 13.9%. The table shows the 2025 generation mix from the Clean Energy Council.
| Source | Share of 2025 generation |
|---|---|
| Coal (black) | 37.5% |
| Wind | 15.7% |
| Solar (rooftop) | 13.9% |
| Coal (brown) | 12.1% |
| Solar (utility) | 7.7% |
| Gas | 6.7% |
| Hydro | 5.3% |
| Battery (discharging) | 0.9% |
| Bioenergy | 0.2% |
Source: Clean Energy Council, Clean Energy Australia 2026, generation mix in 2025.
View the data as a table
| Share | |
|---|---|
| Coal (black) | 37.5% |
| Wind | 15.7% |
| Solar (rooftop) | 13.9% |
| Coal (brown) | 12.1% |
| Solar (utility) | 7.7% |
| Gas | 6.7% |
| Hydro | 5.3% |
| Battery (discharging) | 0.9% |
| Bioenergy | 0.2% |
Rooftop solar out-produces solar farms by nearly two to one, which is why the household market matters so much (see our solar statistics for Australia).
Solar Cobber calculation. Rooftop solar produced 33,927 GWh in 2025. Utility solar at 7.7% of 244,469 GWh is about 18,800 GWh (244,469 x 0.077 = 18,824), so rooftop out-produced solar farms by about 1.8 times. The CEC’s 2025 utility GWh figure is not legible in the report text, so this is derived from the printed percentage.
In the National Electricity Market (the eastern grid and South Australia, not Western Australia), grid-scale solar supplied 7.6% in the June quarter of 2026, up from 6.8% a year earlier, with average output of 1,860 MW, up 12%. These are AEMO figures as reported by pv magazine Australia on 28 July 2026; the national and NEM shares use different scopes and should not be compared directly.
How much new solar farm capacity is being built?
Australia commissioned 2.0 GW of utility-scale solar in 2025, double the previous year, and 2.6 GW of rooftop solar, down 19%. The chart puts new solar farms beside the other 2025 commissioning figures from the Clean Energy Council.
Source: Clean Energy Council, Clean Energy Australia 2026, 2025 key metrics.
View the data as a table
| 2025 | |
|---|---|
| Rooftop solar | 2.6 GW |
| Utility solar | 2.0 GW |
| Large batteries | 2.0 GW |
| Wind | 1.4 GW |
The Clean Energy Council reports that 16 solar farms and 2 hybrid solar and wind projects reached commissioning in 2025. Notable ones were Aldoga, Stubbo and Walla Walla. It also reports that utility-scale solar capital costs fell 8% in 2025, citing CSIRO’s GenCost.
What is curtailment, and how much solar is wasted?
Curtailment is when a solar or wind farm is held below what it could produce, either because the grid cannot carry the power (network curtailment) or because prices are zero or negative (economic curtailment). Across 212 large solar and wind units in the NEM, total curtailment rose from 4.3 TWh in 2024 to 7.2 TWh in 2025.
- Network curtailment
- Economic curtailment
Source: WattClarity GSD2025 data, reported by Dan Lee in pv magazine Australia, 4 February 2026.
View the data as a table
| Network curtailment | Economic curtailment | |
|---|---|---|
| 2024 | 1.20 TWh | 3.15 TWh |
| 2025 | 1.50 TWh | 5.70 TWh |
Economic curtailment grew much faster than network curtailment, reflecting midday price collapses. The same data shows production of 41.8 TWh in 2024 and 50.2 TWh in 2025, against availability of 46 and 57.7 TWh.
Solar Cobber calculation. Curtailment as a share of availability: 4.3 / 46 = 9.3% in 2024 and 7.2 / 57.7 = 12.5% in 2025. This covers solar and wind together, because the source’s solar-only split appears only in charts.
| Measure | 2024 | 2025 |
|---|---|---|
| Production (TWh) | 41.8 | 50.2 |
| Availability (TWh) | 46 | 57.7 |
| Network curtailment (TWh) | 1.2 | 1.5 |
| Economic curtailment (TWh) | 3.15 | 5.7 |
| Total curtailment (TWh) | 4.3 | 7.2 |
| Total as share of availability | 9.3% | 12.5% |
For a household, midday price collapses are why batteries and time-of-use plans pay: see wholesale electricity prices in Australia, the Solar Sharer Offer and virtual power plants.
Solar farms by state and the land they use
In the top five, New South Wales hosts three farms (New England, Stubbo, Walla Walla) and Queensland two (Western Downs, Aldoga). We could not verify a state-by-state capacity total, so we do not give one.
On land use, ACEN states that New England Solar occupies a 2,000 hectare site for up to 720 MW with battery. Solar Cobber calculation: 2,000 ha / 720 MW is about 2.8 hectares per MW across the whole project, a planned figure for that site, not a national average.
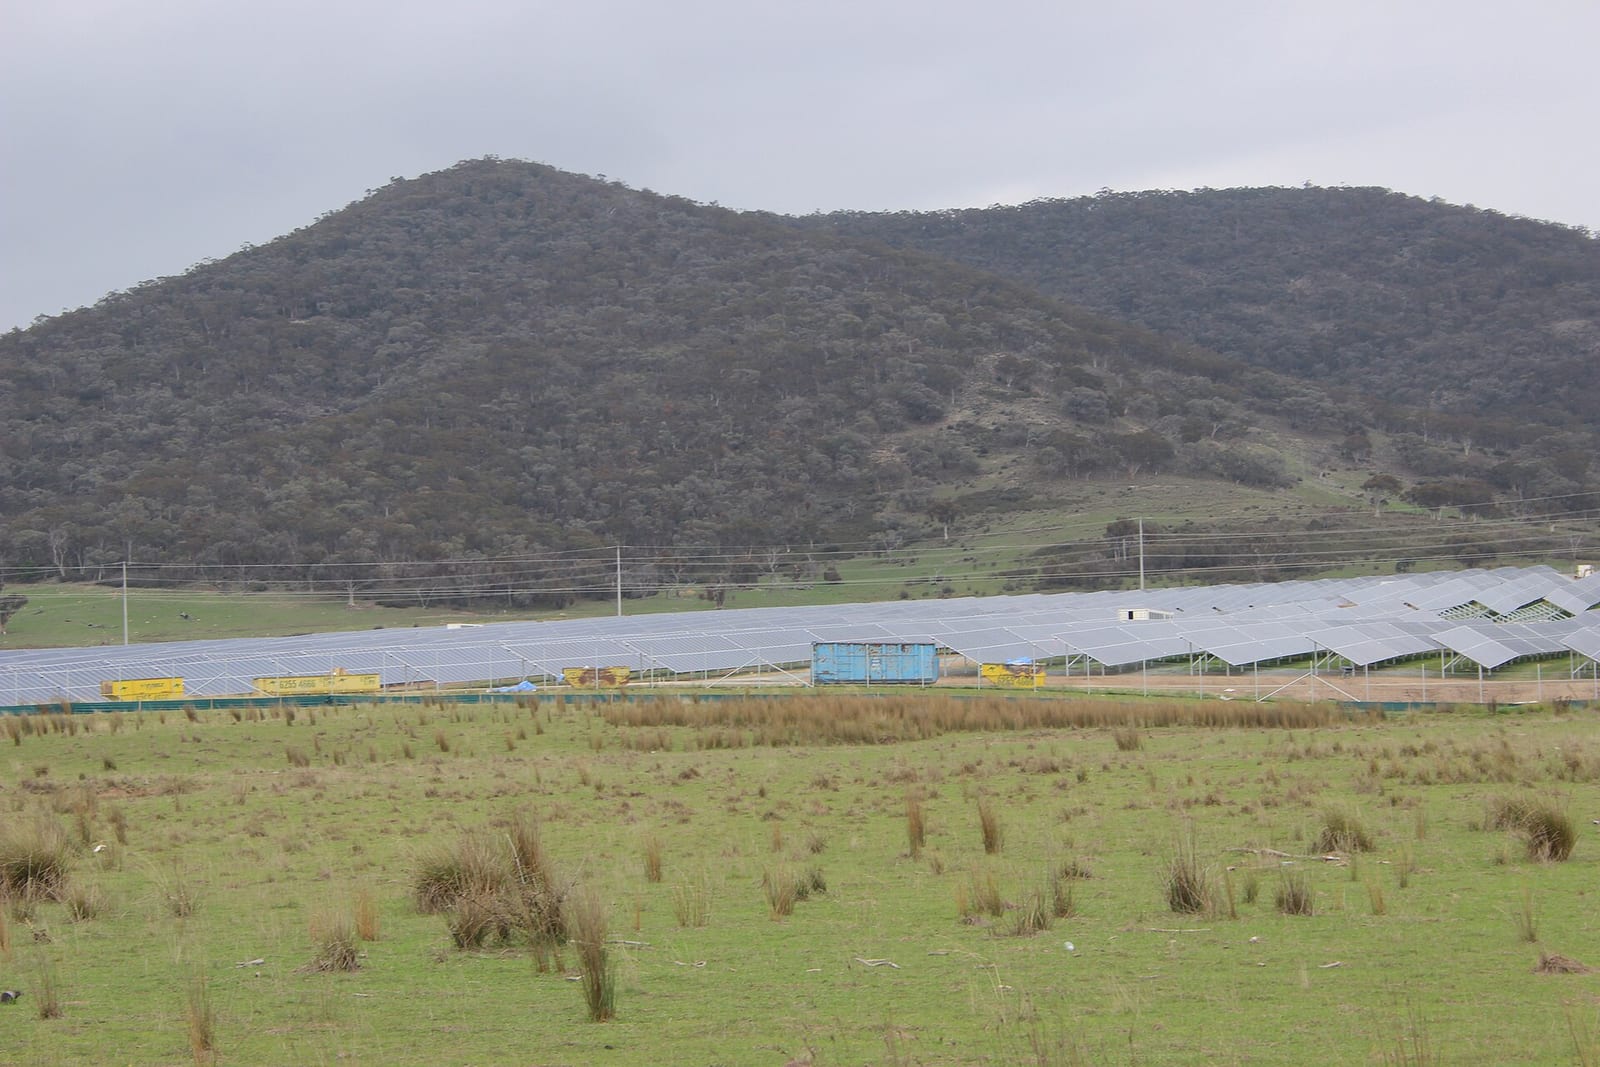
Solar farm vs rooftop solar
A solar farm sells to the grid at wholesale prices and is built by developers, while rooftop solar offsets a household’s own bill and is bought by the homeowner. The differences are summarised below.
| Feature | Solar farm | Rooftop solar |
|---|---|---|
| Typical size | Tens to hundreds of MW (top five: 300 to 400 MW) | CER average new system 10.5 kW in Q2 2026 |
| Share of 2025 generation | 7.7% | 13.9% |
| Who owns it | Energy company or investor | Household or business |
| Income | Wholesale market and contracts | Bill savings and feed-in tariff |
| Exposure to curtailment | Yes, set by the grid operator | Limited to export limits |
Is there a solar farm near me?
The CEC list above covers only the largest five. For a farm near you, check the owner’s project page, your state planning portal or the Australian Energy Market Operator’s generation information, which we could not open for this guide. If you want solar on your own roof instead, see our cost guide, is solar worth it and the installers in your state.
What it means for your solar or battery decision
Economic curtailment is driven by zero and negative midday prices, so a household that uses its own solar, or stores it in a battery, is less exposed than one that exports everything. A battery or daytime load shifting is worth pricing. See home battery statistics and compare local quotes through our top 10 installers and how solar panels work.
Method and sources
Figures marked as Clean Energy Council come from Clean Energy Australia 2026 (data to December 2025, top five correct as of December 2025). Curtailment comes from WattClarity data reported by pv magazine Australia on 4 February 2026, which is secondary reporting. NEM shares come from AEMO via pv magazine Australia on 28 July 2026, also secondary. Project details come from the owners’ pages for ACEN (New England Solar) and Neoen (Culcairn), read in November 2026. Broken Hill details come from Wikipedia. Solar Cobber calculations are labelled. The Clean Energy Council reported 2024 utility solar as 7.2% in its 2025 report and as 6.8% in its 2026 report, so we do not chart a 2024 comparison.
FAQ
What is the largest solar farm in Australia?
Three farms tie at 400 MW as at December 2025: Western Downs Green Power Hub, New England Solar Stage 1 and Stubbo Solar Farm. Culcairn is listed by its owner at 440 MWp (DC), which is a different basis. Always check whether a figure is AC or DC.
How do solar farms work?
Solar farms convert sunlight to electricity in panels, change it to alternating current in inverters and send it through a transformer to the high-voltage grid. Many use trackers that follow the sun. The electricity is sold on the wholesale market or under contracts.
How much of Australia’s electricity comes from solar farms?
Utility-scale solar supplied 7.7% of Australia’s electricity in 2025, according to the Clean Energy Council. Rooftop solar supplied 13.9%. In the NEM alone, grid-scale solar was 7.6% in the June quarter of 2026.
How many solar farms are there in Australia?
We could not verify a current national count. The Clean Energy Council reports that 18 utility-scale solar projects, including 2 hybrid solar and wind, were commissioned in 2025.
What is solar curtailment?
Curtailment is when a farm is held below its possible output because of grid limits or zero and negative prices. In 2025 it removed 7.2 TWh from large NEM solar and wind, about 12.5% of what they could have produced (Solar Cobber calculation).
Is there a solar farm near me?
Check the project owner’s page and your state’s planning portal. This guide lists only the five largest farms, and we could not verify a full list.
Are solar farms or rooftop solar better?
Neither replaces the other. Rooftop solar produced nearly twice as much electricity as solar farms in 2025, and a household’s own panels cut its own bill directly.
Sources
- Clean Energy Council, Clean Energy Australia 2026
- pv magazine Australia, Keeping up with curtailment 2025 (4 February 2026)
- pv magazine Australia, Rooftop solar helps reshape energy markets, AEMO report (28 July 2026)
- ACEN Australia, New England Solar
- Neoen, Culcairn Solar Farm
- Clean Energy Regulator, Quarterly Carbon Market Report June quarter 2026
- Wikipedia, Broken Hill Solar Plant
About this guide
Written by the Solar Cobber editorial team from independent desk research checked in November 2026. Solar Cobber is a free directory that may earn referral or advertising fees from installers; commercial relationships never affect our content. This is general information, not financial advice. Corrections: contact us.
Filed under Solar Guides
Back to blog