
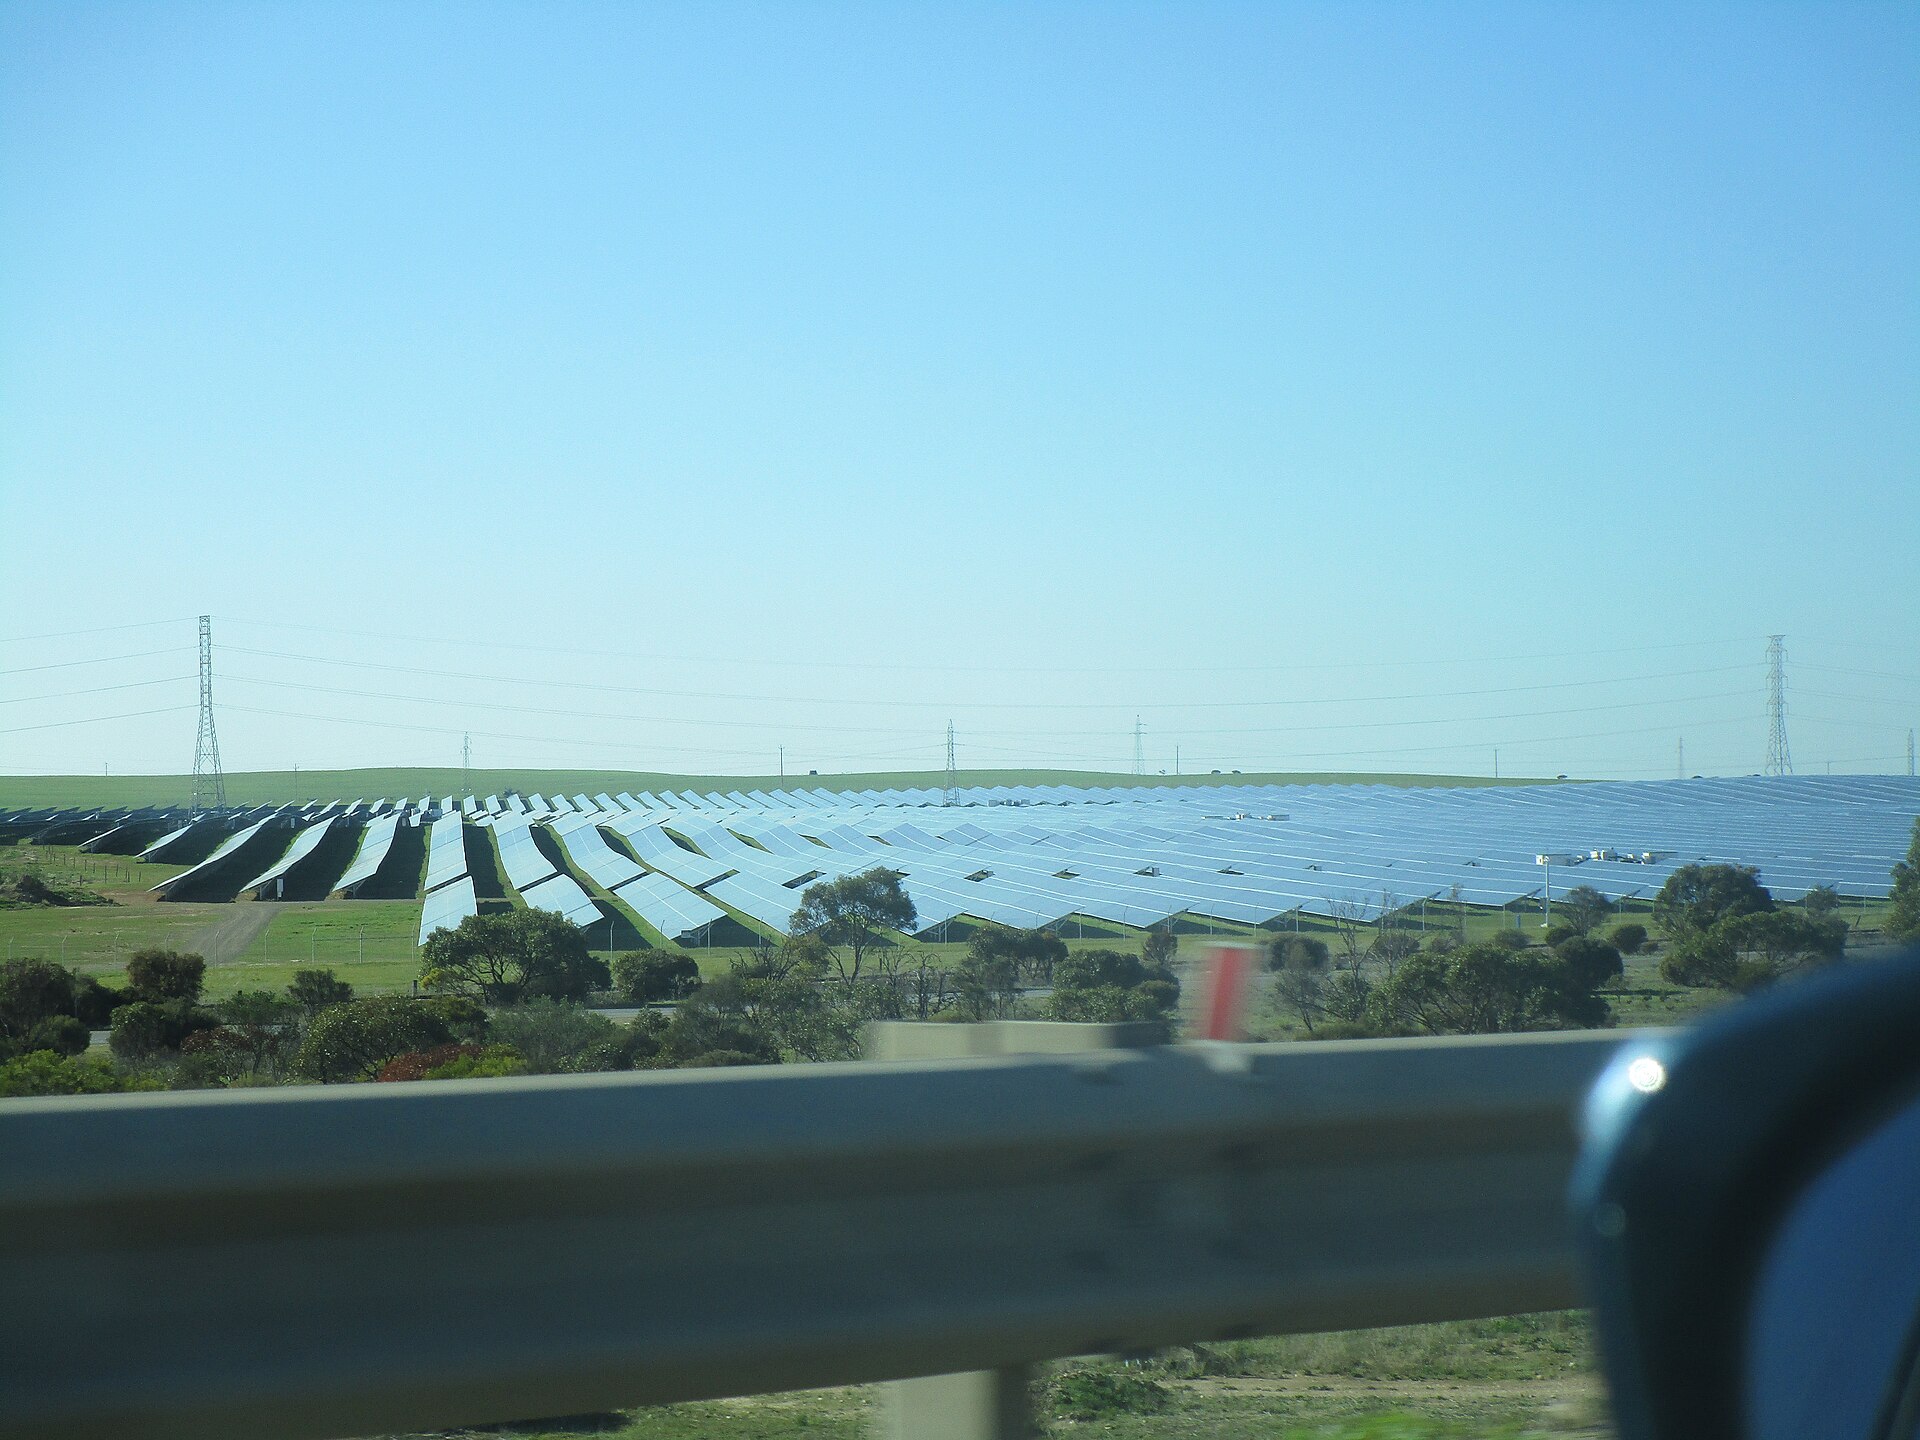
If you search “solar installers near me” in Toowoomba, our directory holds 21 companies covering your postcode. Search from Melbourne’s CBD and the number drops to 14. That is the finding in one line: the best-served postcodes in Australia are regional centres, not capital cities.
We pulled the geographic data from the Solar Cobber directory on 2 August 2026. It covers 1,611 solar companies, with recorded coverage across 545 postcodes and 743 suburbs. This post sets out how many installers we track per state, what happens when you adjust for population, which postcodes come out on top, and what that means when you are the one asking for quotes. The method and its weaknesses are at the bottom, and they matter.
The headline numbers
| Measure (as at 2 August 2026) | Figure |
|---|---|
| Companies in the directory | 1,611 |
| Postcodes with recorded coverage | 545 |
| Suburbs with recorded coverage | 743 |
| State or territory entries in the state table | 1,201 |
| Best-served postcode | 4350 Toowoomba, with 21 companies |
| Companies in the twentieth-placed postcode | 10 |
That last pair is worth sitting with. The gap between the best-served postcode in the country and the twentieth best-served is 21 companies against 10. Nowhere in our data does a single postcode have dozens of installers on tap. Australian solar is a market of small local operators spread thin, even at its most crowded.
Installers by state
Here is the raw count, using the state recorded against each listing.
| State or region | Companies | Avg rating | Total reviews |
|---|---|---|---|
| New South Wales | 332 | 4.82 | 35,015 |
| Victoria | 283 | 4.80 | 22,777 |
| Queensland | 188 | 4.82 | 18,736 |
| Western Australia | 158 | 4.78 | 20,319 |
| South Australia | 110 | 4.89 | 8,480 |
| National operators | 43 | 4.78 | 3,126 |
| Australian Capital Territory | 38 | 4.77 | 3,632 |
| Northern Territory | 30 | 4.81 | 1,626 |
| Tasmania | 19 | 4.91 | 1,195 |
Two honest notes before you read anything into it. First, those rows add up to 1,201 entries, not the full 1,611 companies in the directory. The rest have no usable state recorded on their listing, and we would rather leave them out than guess. Second, a company that covers more than one state can appear in more than one row, so 1,201 is a count of state entries, not a count of distinct businesses. The rows are not mutually exclusive and you should not treat them as a tidy pie chart.
On raw counts the table is dull. New South Wales has the most companies, Victoria is second, Tasmania is last. That is roughly the order of the states by population, which is what you would expect and which tells you almost nothing useful.
Adjusted for population, the order flips
The interesting version is per head. We used the Australian Bureau of Statistics National, state and territory population release, estimated resident population at 31 December 2025. That is external context, not our data, and it is the only outside number in this post.
| State or territory | Companies | Population at 31 Dec 2025 | Companies per 100,000 people |
|---|---|---|---|
| Northern Territory | 30 | 267,500 | 11.2 |
| Australian Capital Territory | 38 | 487,200 | 7.8 |
| South Australia | 110 | 1,910,600 | 5.8 |
| Western Australia | 158 | 3,076,500 | 5.1 |
| Victoria | 283 | 7,121,900 | 4.0 |
| New South Wales | 332 | 8,641,100 | 3.8 |
| Queensland | 188 | 5,712,100 | 3.3 |
| Tasmania | 19 | 579,100 | 3.3 |
Now the ranking is upside down. New South Wales drops from first to sixth. The Northern Territory, which is last but one on raw count, comes first by a wide margin. South Australia and Western Australia, two states with long solar histories and plenty of sun, sit well above the big eastern states.
Be careful with the top two. The Northern Territory has 30 companies and the ACT has 38. When the base is that small, a handful of listings moves the rate a long way, and both are single-city markets where nearly every business sits in or near one urban area. Read them as “small population, decent number of firms”, not as proof that Darwin is the easiest place in Australia to get three quotes.
The bottom of the table is the more telling result. Queensland and Tasmania land at effectively the same rate, 3.3 companies per 100,000 people, which is a strange pair. One is hot, sunny and one of the highest rooftop solar states in the country. The other is cool, cloudier and heavily hydro powered. Getting the same density from opposite ends of the climate map is a reminder that installer counts follow business geography, not sunshine.
You can browse any of these markets directly:
| State | Top installers page | Regional directory |
|---|---|---|
| New South Wales | Top 10 NSW installers | NSW companies |
| Victoria | Top 10 Victorian installers | Victorian companies |
| Queensland | Top 10 Queensland installers | Queensland companies |
| Western Australia | Top 10 WA installers | WA companies |
| South Australia | Top 10 SA installers | SA companies |
| Tasmania | Top 10 Tasmanian installers | Tasmanian companies |
The 20 best-served postcodes
This is the part of the data we did not expect. Below are the postcodes with the most companies recorded as covering them, with the town or suburbs each postcode actually contains.
| Postcode | Where it is | Companies |
|---|---|---|
| 4350 | Toowoomba and surrounds, QLD | 21 |
| 6230 | Bunbury, South Bunbury, Dalyellup, WA | 20 |
| 2911 | Crace and Mitchell, in Gungahlin, ACT | 18 |
| 6280 | Busselton, Vasse, Geographe, WA | 16 |
| 3000 | Melbourne CBD, VIC | 14 |
| 2640 | Albury, NSW | 14 |
| 2153 | Baulkham Hills, Bella Vista, Winston Hills, NSW | 14 |
| 3029 | Hoppers Crossing, Tarneit, Truganina, VIC | 13 |
| 4670 | Bundaberg, QLD | 13 |
| 4870 | Cairns, QLD | 12 |
| 2650 | Wagga Wagga, NSW | 12 |
| 3550 | Bendigo, VIC | 12 |
| 4810 | Townsville, QLD | 11 |
| 4655 | Hervey Bay, QLD | 11 |
| 5000 | Adelaide CBD, SA | 11 |
| 2150 | Parramatta and Harris Park, NSW | 11 |
| 2164 | Smithfield and Wetherill Park, NSW | 10 |
| 6065 | Wanneroo, Landsdale, Hocking, WA | 10 |
| 6017 | Osborne Park and Herdsman, WA | 10 |
| 4700 | Rockhampton, QLD | 10 |
Postcode locations checked against postcodes-australia.com, August 2026.
Look at what is missing. No Sydney CBD postcode. No Brisbane CBD, no Perth CBD, no Hobart, no Darwin, no Canberra city centre. The only two capital city cores on the list are Melbourne on 14 and Adelaide on 11, and both sit mid-pack, beaten by Toowoomba, Bunbury, Gungahlin and Busselton.
Eleven of the 20 are regional centres: Toowoomba, Bunbury, Busselton, Albury, Bundaberg, Cairns, Wagga Wagga, Bendigo, Townsville, Hervey Bay and Rockhampton. The rest are mostly outer suburbs and trade areas, not city centres. Wanneroo and Hoppers Crossing are growth corridors full of new detached housing. Osborne Park and Wetherill Park are light industrial pockets where trade businesses keep their yards and vans. Gungahlin is Canberra’s newest big residential district.
Why regional centres come out on top
Nothing here is a mystery once you think about how a solar business makes money.
The roofs are bigger. Detached houses on larger blocks in Toowoomba, Bundaberg or Bunbury take bigger systems than an inner-city terrace or an apartment. A bigger system is a bigger job, and a bigger job pays better for the same day of labour.
Self-consumption is higher. Regional households more often have someone home during the day, and they run pool pumps, sheds, workshops and air conditioning through summer afternoons. They use more of what the panels make instead of exporting it. Solar pays back faster when you use the power yourself, which is truer than ever now that feed-in tariffs have shrunk. We cover why in our guide to feed-in tariffs.
Uptake is already strong. Regional Queensland, regional Western Australia and inland New South Wales have been putting solar on roofs for years. High existing uptake means more service work, more upgrades, more battery retrofits and more word-of-mouth referrals, which supports more local firms.
There is less competition from national brands. Big national operators concentrate their marketing and their crews where the population is densest. A local firm in Busselton faces fewer heavily advertised rivals than one in Sydney’s inner west, so a small local team can hold a solid share of its own town.
Cities have their own drag. Capital city CBDs are apartments, offices and strata buildings. There is very little detached rooftop to sell to, so a CBD postcode is a place companies list an office, not a place they do many jobs.
What density actually means for your quotes
Installer density is not trivia. It changes what happens when you pick up the phone.
In a well-served postcode
You can get three or four quotes in a week without stretching. That is the biggest lever a homeowner has, because a competitive quote is not just a lower price. It is a better panel and inverter combination, a clearer scope, and fewer vague line items, since each company knows you are comparing. Our walkthrough on how to compare solar quotes sets out the fields to line up side by side.
Density also helps after the sale. If ten firms work your area, someone can usually get to a fault call in a reasonable window, and if your original installer folds you have local options for warranty and repair work. Aftercare is where thin markets hurt most, and it is the part buyers think about least.
In a thinly served postcode
If only two companies cover your area, you have a problem you cannot fix by negotiating harder. With two quotes you have no way to tell whether both are high. Lead times stretch, because one busy team can only get to so many roofs. A fault call can mean waiting for a crew to be in your district. And if one of the two stops trading, your local market halves overnight.
Practical ways to handle a thin market:
- Widen your search radius before you decide. Companies from the nearest regional centre often travel further than their listing suggests, especially for a full system rather than a service call.
- Ask directly whether the crew doing your install is employed by the company or subcontracted, and who handles a warranty call in three years.
- Get one quote from a national operator purely as a price reference, even if you would rather use a local firm. It tells you whether your local numbers are sane.
- Do not let scarcity rush you into a deposit. Our guide on choosing a solar installer lists the checks worth doing regardless of how few options you have.
One thing density does not tell you
It does not tell you about quality. Across our whole directory the average rating barely moves from state to state, from 4.77 in the ACT to 4.91 in Tasmania. A busier postcode is not a better-rated one. More choice gives you more pricing power and better odds on service response, not a higher floor on workmanship. You still have to do the checking yourself.
Methodology
What the data is. Aggregated public Google Business listing data for solar companies in the Solar Cobber directory. That includes recorded location and service area fields, star ratings and review counts. No company was contacted, paid or asked for information.
Sample size. 1,611 companies, of which 1,222 carry a public star rating and 1,250 have usable location data. Recorded coverage spans 545 postcodes and 743 suburbs.
When and how. Every directory figure here comes from one set of queries run against our live database on 2 August 2026. Population figures are from the Australian Bureau of Statistics, estimated resident population at 31 December 2025. Postcode locations were checked against public postcode records in August 2026.
Limitations, stated plainly:
- This is a large sample, not a census. The directory holds 1,611 companies with public business listings. It is big enough to show patterns and far too incomplete to describe the whole Australian solar market. Any firm without a public listing is invisible to us.
- An address is not a service area. Business listings record where a company is based and, sometimes, where it says it works. Neither is a map of where crews actually drive. A national operator with a Sydney head office still installs in regional New South Wales, and a Toowoomba firm may quote three hours away. Postcode counts should be read as coverage signals, not service guarantees.
- The state table is partial. It covers listings with a recorded state and adds to 1,201 entries, well short of the 1,611 companies in the directory. We did not fill the gap with estimates.
- State counts are not mutually exclusive. A company working across more than one state can appear in more than one row, so the rows cannot be added together to get a count of distinct businesses.
- Population is external context. ABS population figures are not our data. We used them to put our own counts in proportion, and the ratios are only as good as the underlying company counts, which have the limits above.
- Small bases move fast. The Northern Territory (30 companies) and Tasmania (19 companies) have bases small enough that a few listings shift their per-head rate noticeably. Treat those two rows with more caution than the rest.
We do not track, verify or display any company’s Clean Energy Council accreditation status. If accreditation matters to you, and it should, check the New Energy Tech Consumer Code approved seller directory for the retailer, and check the individual installer’s accreditation with Solar Accreditation Australia, which took over installer accreditation in 2024, yourself before you sign.
FAQ
How many solar installers should I get quotes from?
Three is the working minimum, and in a well-served postcode you can do that in a week. Two quotes cannot tell you whether both are expensive. If your area only supports two, widen the radius or add a national operator as a price check.
Does more competition mean cheaper solar?
It usually means more pressure on the quote, which shows up as sharper pricing, better equipment for the same money, or a clearer scope. It does not guarantee the cheapest possible price, and the cheapest quote is often the one with the thinnest warranty and the vaguest inclusions.
Why does a regional town have more installers than a capital city CBD?
Because CBDs are apartments and offices with almost no residential rooftop to sell to. Regional towns are detached houses with large roofs, high daytime power use and years of solar uptake behind them. The work is where the roofs are.
Is a local installer better than a national one?
Not automatically. Locals are often quicker on service calls. National operators can have better buying power and more structured warranty handling. Our directory holds 43 national operators, and their average rating (4.78) is slightly below the spread. Judge each on warranty terms, who does the install, and how they handle faults. We compare the big ones in our national solar companies guide.
What happens if my installer goes out of business?
Your panel and inverter product warranties sit with the manufacturer and survive the installer. The workmanship warranty usually does not. That is the real risk in a thin market, because you may struggle to find another local firm willing to take on someone else’s install. Ask who backs the workmanship cover before you pay a deposit.
Does this data tell me which company to use?
No. It tells you how much choice you are likely to have and how hard you can push on price. Ratings across the directory sit in a narrow band from 4.77 to 4.91 by state, so density is about your negotiating position, not about quality. Start with your state directory and shortlist from there.
Related reading
- The Australian Solar Installer Report 2026
- where regional Australia runs out of installers
- how every state compares on installer ratings
- when you can actually reach a solar installer
About this research
This is independent desk research by Solar Cobber. We did not visit sites, request quotes or accept payment for inclusion. Figures are dated and sourced, and pricing and policy details change, so confirm current terms directly before you sign anything.