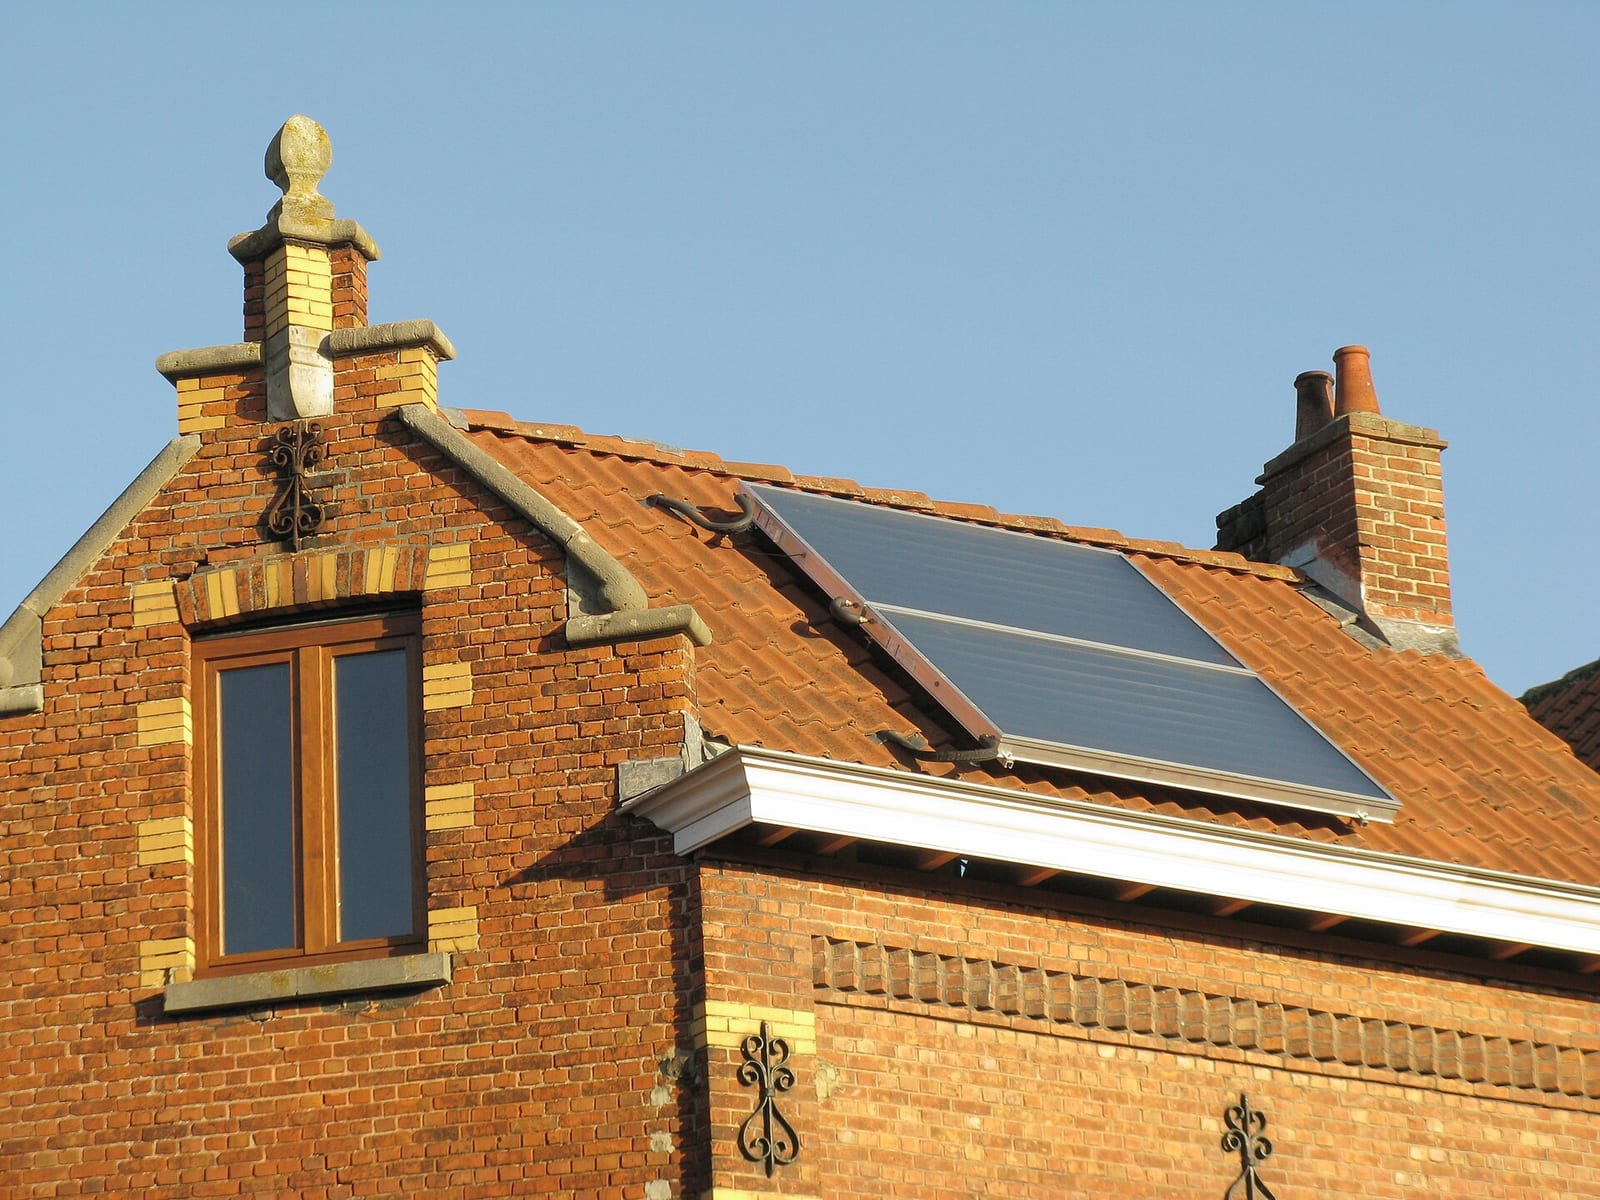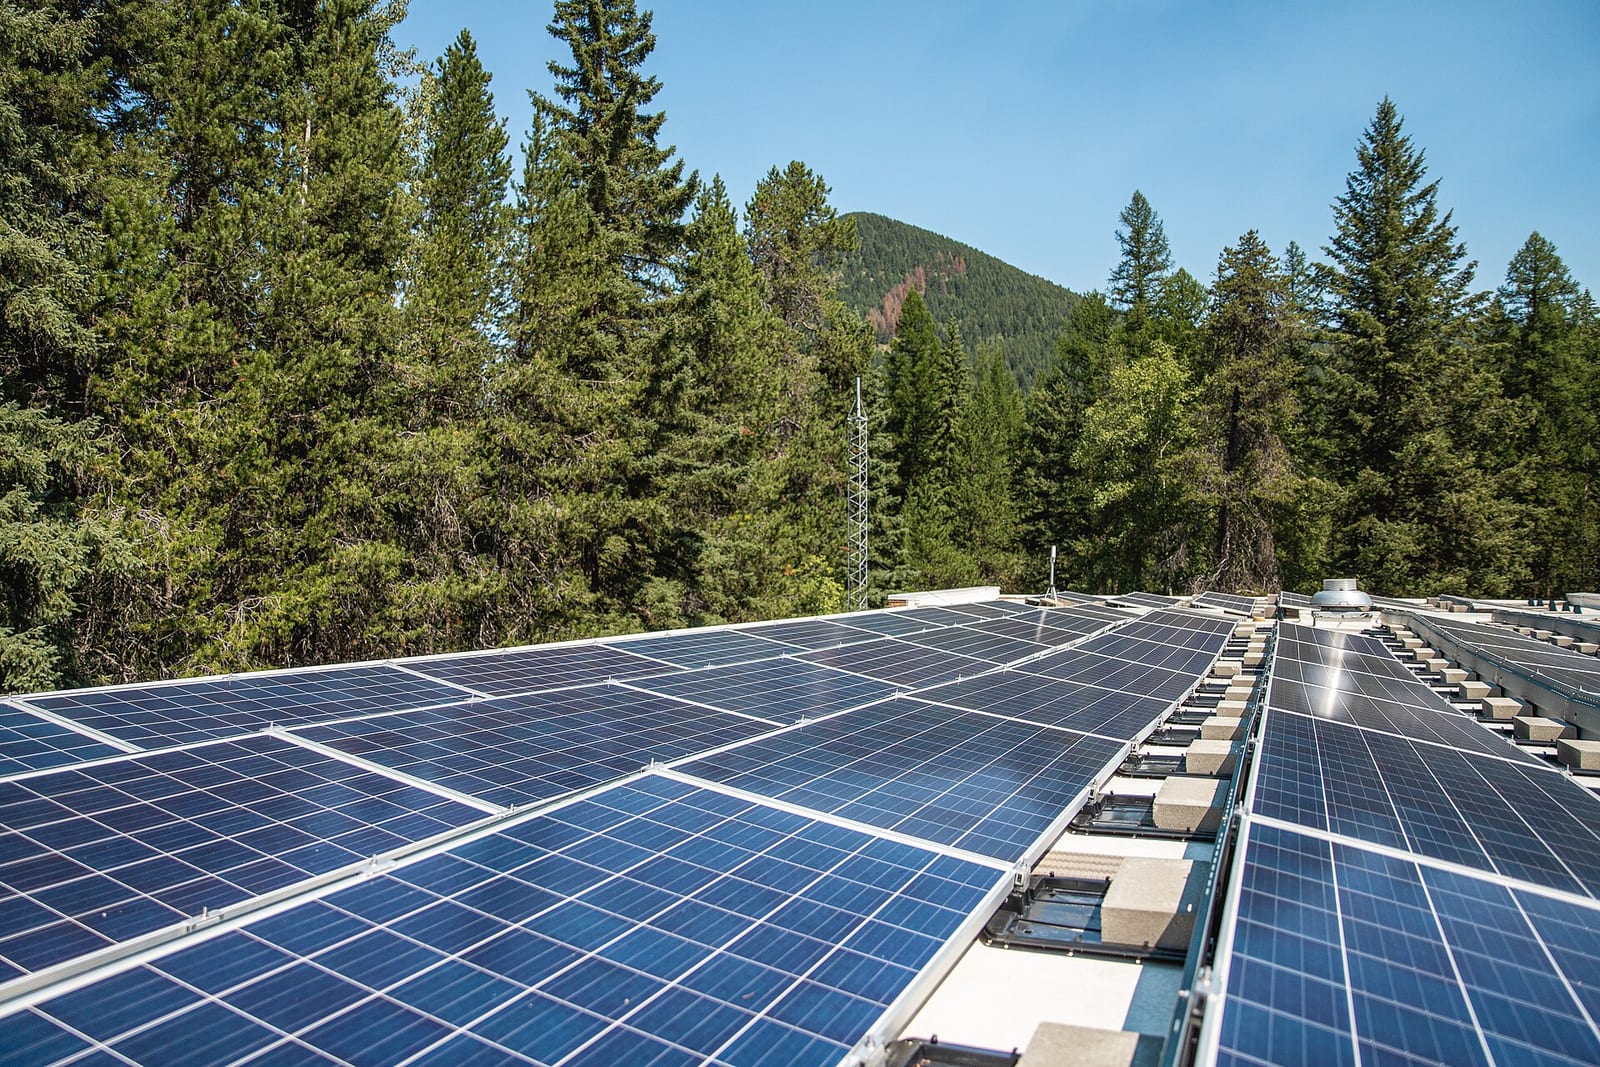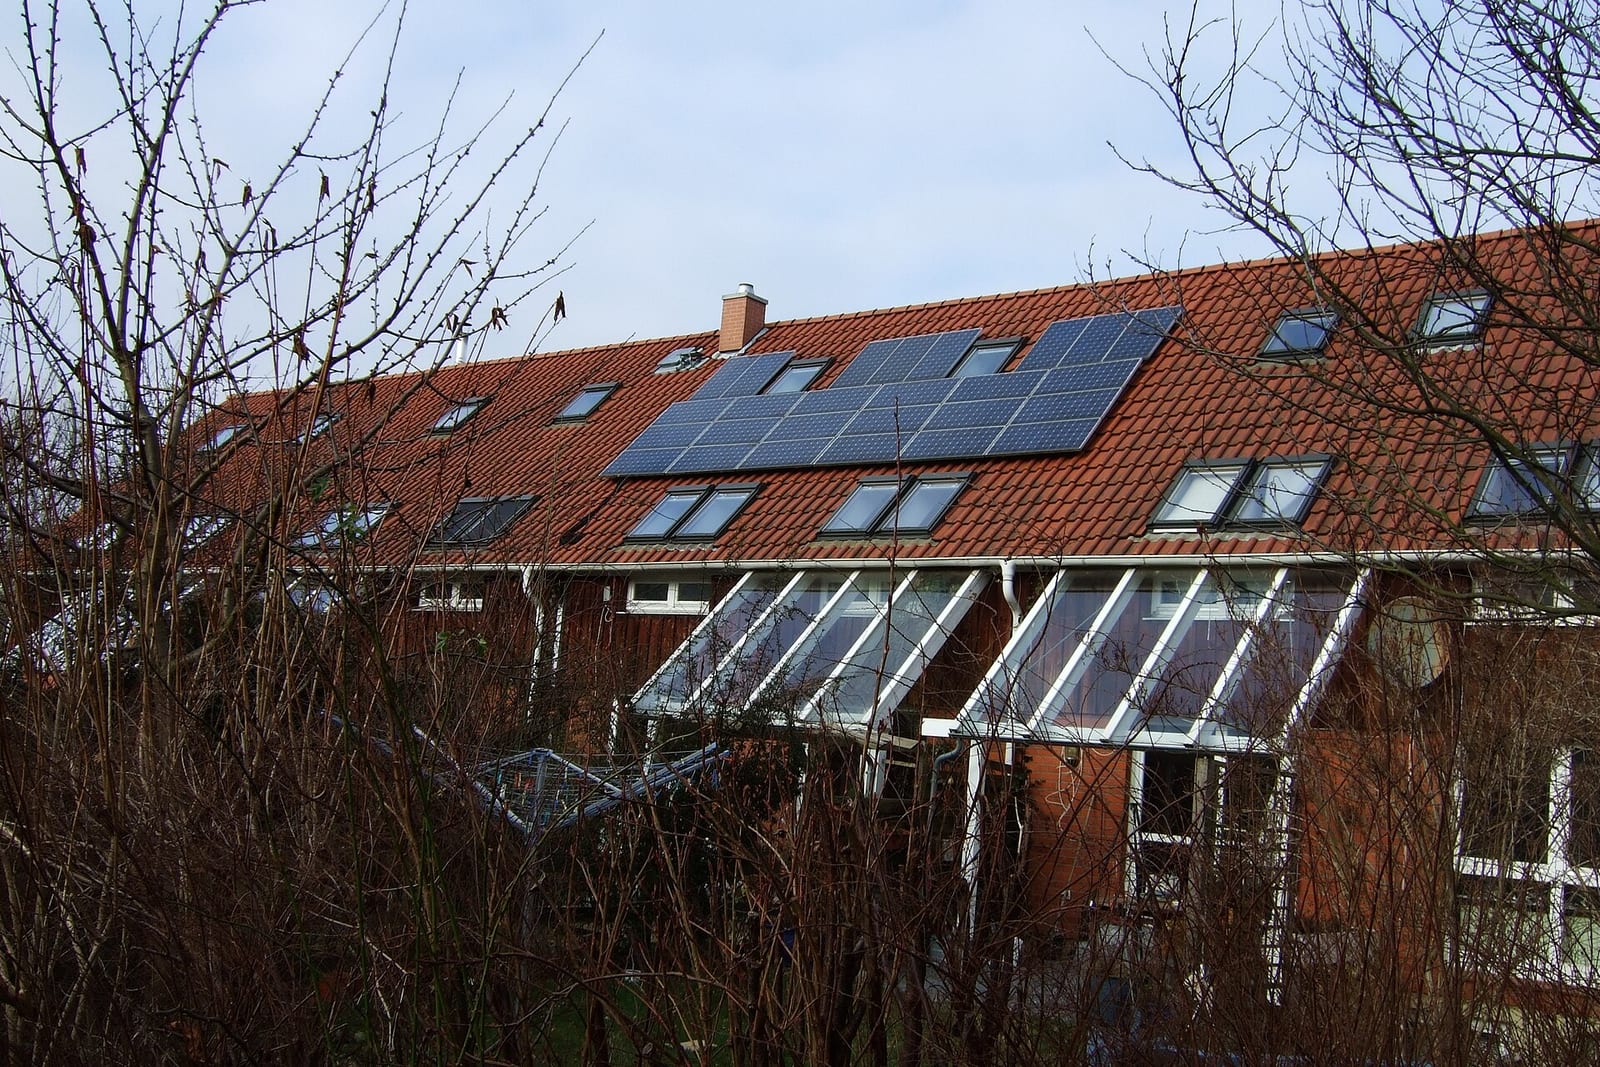

The best solar panel angle in Australia is a tilt of about 30 degrees facing true north, and a modelled Sydney system on that setting makes about 1,567 kWh a year for each kW of panels. A north-facing roof at 20 degrees makes 98% of that, an east or west roof makes about 84%, and a south roof makes about 66%. The figures below are modelled for eight capital cities as at November 2026.
Key facts
- A fixed solar panel facing true north at a 30 degree tilt gave the highest modelled annual output in six of the eight capital cities tested (Sydney, Melbourne, Brisbane, Perth, Adelaide and Canberra), using the European Commission’s PVGIS tool in November 2026.
- A north-facing roof at 20 degrees in Sydney makes about 98% of the output of the best fixed panel, so a normal pitched roof loses very little against a perfect frame.
- East-facing or west-facing panels at 20 degrees make about 84% of the best fixed output in Sydney, Melbourne and Canberra, and about 93% in Darwin (Solar Cobber calculation from PVGIS).
- A 20 degree south-facing roof makes about 66% of the best output in Sydney and Melbourne, and about 84% in Darwin.
- In June, an east and west split at 20 degrees produces about 65% as much as a north-facing array in Sydney, so most of the east-west penalty falls in winter.
- To match the annual output of 6.6 kW of north-facing panels, a Sydney east and west roof needs about 7.7 kW, roughly three extra 440 W panels.
How this guide’s numbers were produced
Every output figure on this page comes from the European Commission’s PVGIS tool (version 5.3, PVGIS-ERA5 radiation data for 2005 to 2023), queried on 14 November 2026 for the centre of each capital city. Each run modelled 1 kW of crystalline silicon panels on a fixed frame, with the tool’s default 14% system losses and no shading. We ran 6 facings and 7 tilts for each city and expressed results as kWh per kW per year.
These are modelled figures, not measurements of real roofs, so read them as ratios between roofs in the same city. For daily output by city, see what size solar system you need.
What is the best angle for solar panels in Australia?
The best fixed tilt in Australia is roughly 30 degrees in most capitals, rising to 40 degrees in Hobart and falling to 20 degrees in Darwin. Output is flat near the peak, so a tilt anywhere between 20 and 40 degrees gives at least 94% of the best result in every city.
Tilt matters less than most people expect. A flat panel at 0 degrees still makes 86% of the best output in Sydney and 97% in Darwin, because the sun is high in the sky for much of the year. The chart shows how output changes with tilt for four cities, each as a share of its own best tested tilt.
- Sydney
- Melbourne
- Perth
- Darwin
View the data as a table
| Sydney | Melbourne | Perth | Darwin | |
|---|---|---|---|---|
| Flat (0) | 86% | 86% | 90% | 97% |
| 10 degrees | 93% | 93% | 95% | 99% |
| 20 degrees | 98% | 98% | 99% | 100% |
| 30 degrees | 100% | 100% | 100% | 98% |
| 40 degrees | 100% | 100% | 99% | 94% |
| 60 degrees | 92% | 92% | 88% | 78% |
Between 20 and 40 degrees, a north-facing panel in Sydney, Melbourne or Perth is within 2% of the best result; Darwin peaks at 20 degrees and falls away faster at steep angles.
| City | Flat (0) | 10 degrees | 20 degrees | 30 degrees | 40 degrees | 60 degrees |
|---|---|---|---|---|---|---|
| Sydney | 1,346 | 1,456 | 1,530 | 1,567 | 1,565 | 1,443 |
| Melbourne | 1,259 | 1,358 | 1,425 | 1,458 | 1,456 | 1,345 |
| Brisbane | 1,385 | 1,470 | 1,520 | 1,534 | 1,511 | 1,353 |
| Perth | 1,516 | 1,615 | 1,674 | 1,692 | 1,669 | 1,497 |
| Adelaide | 1,406 | 1,506 | 1,571 | 1,598 | 1,588 | 1,449 |
| Canberra | 1,347 | 1,454 | 1,526 | 1,562 | 1,560 | 1,441 |
| Hobart | 1,122 | 1,228 | 1,304 | 1,350 | 1,364 | 1,291 |
| Darwin | 1,583 | 1,630 | 1,638 | 1,608 | 1,540 | 1,285 |
The table shows modelled annual output in kWh per kW of north-facing panels by tilt (PVGIS-ERA5, queried November 2026). We did not test tilts steeper than 60 degrees for Hobart’s peak, so its true best may sit between 40 and 50 degrees.
Does a steeper angle help in winter?
A steeper tilt moves output from summer to winter but lowers the annual total. In Sydney a 60 degree north-facing panel makes about 92% of the best annual output.
Bureau of Meteorology averages show why this matters. At Sydney Airport the mean solar exposure is 2.42 kWh/m2 a day in June and 6.53 kWh/m2 in December, so a June day delivers about 37% of a December day before any roof angle is considered. Hobart is more extreme at 1.33 kWh/m2 in June against 6.53 in December (Bureau of Meteorology climate averages, checked November 2026). For most homes, adding a little more capacity is cheaper than building a steep frame. Our guide on panels on cloudy days covers the same point.
What is the best direction for solar panels in Australia?
The best direction for solar panels in Australia is true north, because the sun spends the day in the northern half of the sky. A panel pointing north-east or north-west at 20 degrees still makes about 94% of the best output in Sydney, which is why a roof that is not perfectly aligned is rarely a problem.
View the data as a table
| Share of best annual output | |
|---|---|
| North, 30 degrees tilt | 100% |
| North, 20 degrees | 98% |
| North-east | 94% |
| North-west | 94% |
| East | 84% |
| West | 84% |
| South | 66% |
In Sydney, a north-facing roof makes 98% of the best output, east and west roofs about 84%, and a south-facing roof about 66%.
The same pattern holds across the country, with the gap between north and east or west narrowest in the tropics.
| City | North | North-east | North-west | East | West | South |
|---|---|---|---|---|---|---|
| Sydney | 1,530 | 1,471 | 1,467 | 1,315 | 1,310 | 1,030 |
| Melbourne | 1,425 | 1,372 | 1,369 | 1,230 | 1,224 | 975 |
| Brisbane | 1,520 | 1,478 | 1,466 | 1,354 | 1,337 | 1,113 |
| Perth | 1,674 | 1,629 | 1,611 | 1,487 | 1,462 | 1,207 |
| Adelaide | 1,571 | 1,520 | 1,511 | 1,373 | 1,363 | 1,105 |
| Canberra | 1,526 | 1,471 | 1,462 | 1,320 | 1,304 | 1,036 |
| Hobart | 1,304 | 1,253 | 1,241 | 1,106 | 1,090 | 845 |
| Darwin | 1,638 | 1,619 | 1,597 | 1,543 | 1,515 | 1,375 |
The table shows modelled annual output in kWh per kW of panels at a 20 degree tilt by direction (PVGIS-ERA5, queried November 2026). West-facing panels make slightly less than east-facing in the model, by about 0.4% to 2%.
Compass directions here mean true north, not magnetic north. The two differ by several degrees across Australia, and a phone compass reads magnetic north unless the app corrects it, so ask your installer to measure the roof azimuth against true north.
Can I put solar panels on a south-facing roof?
Yes, but a south-facing roof makes only about 62% to 73% of the best output in every capital except Darwin (84%), so it should be a last resort. At 20 degrees, Sydney south panels make 1,030 kWh per kW against 1,530 kWh for north panels. Use any north, east or west face first.
Are east-west solar panels worth it?
East-west panels are worth it when your roof has no usable north face, or when you use most of your power in the morning and evening. They make about 84% as much energy a year as a north roof in Sydney, but spread it across a longer day: less at midday, more early and late.
- North-facing
- East and west split
View the data as a table
| North-facing | East and west split | |
|---|---|---|
| Jan | 4.85 kWh | 4.85 kWh |
| Feb | 4.59 kWh | 4.32 kWh |
| Mar | 4.11 kWh | 3.58 kWh |
| Apr | 3.78 kWh | 2.92 kWh |
| May | 3.41 kWh | 2.33 kWh |
| Jun | 2.83 kWh | 1.85 kWh |
| Jul | 3.31 kWh | 2.19 kWh |
| Aug | 3.98 kWh | 2.90 kWh |
| Sep | 4.63 kWh | 3.83 kWh |
| Oct | 4.85 kWh | 4.45 kWh |
| Nov | 4.93 kWh | 4.84 kWh |
| Dec | 5.04 kWh | 5.13 kWh |
In Sydney the two layouts are almost level in summer and December favours east-west slightly (5.13 against 5.04 kWh per kW a day), but in June the east and west split makes 1.85 kWh against 2.83 kWh for north.
The loss is concentrated in winter and gets worse further south, as the next chart shows.
View the data as a table
| East-west output in June, share of north | |
|---|---|
| Darwin | 78% |
| Brisbane | 70% |
| Perth | 66% |
| Canberra | 66% |
| Sydney | 65% |
| Adelaide | 65% |
| Melbourne | 63% |
| Hobart | 58% |
An east and west roof in Hobart makes only 58% of a north roof’s output in June, while Darwin keeps 78%.
East-west layouts earn their place in three situations. First, the roof has an east and a west face but no north face. Second, you are on a time-of-use or two-way tariff where early and late power is worth more than midday power; see our guides to peak and off-peak times and the feed-in tariff tracker. Third, your inverter is small and a flatter daily curve means less clipping at midday (our model does not include clipping, so ask your installer).
Solar Cobber calculation: what does an east-west roof cost you?
A 6.6 kW system facing north in Sydney would make about 10,098 kWh a year, while the same 6.6 kW split evenly east and west makes about 8,666 kWh. The difference is 1,432 kWh a year, or 14.2%.
| Step | North-facing | East and west split |
|---|---|---|
| Modelled output per kW per year (20 degrees, Sydney) | 1,530 kWh | 1,313 kWh (average of 1,315 east and 1,310 west) |
| Output of a 6.6 kW system | 6.6 x 1,530 = 10,098 kWh | 6.6 x 1,313 = 8,666 kWh |
| Shortfall against north | none | 1,432 kWh (14.2%) |
| System size needed to match north | 6.6 kW | 6.6 x 1,530 / 1,313 = 7.7 kW |
| Panels at 440 W | 15 | 18 (7.92 kW) |
The table works through the maths using the PVGIS figures above. Matching a north roof takes about three more panels. Solar Choice’s November 2026 price index puts a standard 6 kW system in Sydney at A$5,800 and a 7 kW system at A$6,510, a difference of about A$710 for each extra kW. Multiply your shortfall in kWh by your own import rate to see what is at stake, then compare it with the cost of extra panels.
How steep should my roof be, and what if it is flat?
A flat roof is the easiest case, because you choose the tilt. On a flat roof, tilt panels to 10 to 15 degrees so rain washes them clean and rows do not shade each other. A 10 degree tilt makes about 93% of the best output in Sydney, against 86% flat.
On a pitched roof you usually should not change the tilt. Tilt frames add cost and wind loading, and at 20 degrees you already have 98% of the best output in Sydney.
Panel size matters for fit as well as output, so check the roof space against solar panel sizes and dimensions.
Does shade matter more than angle?
Yes. Often, yes. A slightly off-north roof with no shade usually beats a perfect north roof under a tree, because shade on one panel can drag down a whole string on a basic inverter. Optimisers or microinverters reduce that effect; our guide to solar panel optimisers explains when they pay. Low-tilt panels also hold dust, as covered in solar panel cleaning cost.
Should I split panels across more than one roof face?
Often yes, when no single face holds the whole system. A split such as 4 kW north and 2.6 kW west gives a result between the north and west columns of the table above. Most inverters have two or more inputs so each face runs on its own string.
What to check on your quote
Ask the installer for the azimuth and tilt of each panel group, the modelled annual kWh for each group, and the shading assumption. Our guide on how to compare solar quotes lists the other items to check, and you can find local installers on our installer directory.
FAQ
What is the best angle for solar panels in Australia?
The best fixed angle is about 30 degrees in most capitals, 40 degrees in Hobart and 20 degrees in Darwin. These are the highest annual outputs in our PVGIS runs of November 2026, and results within 20 to 40 degrees differ by only a few per cent.
What is the best direction for solar panels in Australia?
True north is best because the sun sits in the northern sky for most of the day. North-east and north-west roofs at 20 degrees make about 94% of the best output in Sydney.
Do east-west solar panels work well?
East-west panels make about 84% of a north-facing roof’s annual output in Sydney, Melbourne and Canberra, and about 93% in Darwin. They suit homes with morning and evening demand, but winter output falls more than summer output.
Can solar panels face south in Australia?
Solar panels can face south, but at 20 degrees they make only about 66% of the best output in Sydney and Melbourne. Use north, east or west faces first.
Is a 20 degree roof pitch good enough for solar?
A 20 degree north-facing roof makes about 98% of the best output in Sydney, Melbourne, Canberra and Adelaide, and 99% in Brisbane and Perth. A normal pitched roof needs no tilt frame.
How much does roof direction change my solar savings?
Roof direction changes annual output by about 14% between a north roof and an east or west roof in Sydney. Multiply the lost kWh by your own import rate or feed-in rate to see the dollar effect.
Should I tilt my panels more in winter?
For most homes, no. A steeper tilt moves some output from summer to winter but lowers the annual total, and adding a few panels is usually cheaper than building a steep frame.
Do I need a tilt frame on a flat roof?
A tilt of 10 to 15 degrees helps on a flat roof because it sheds water and dirt, and a 10 degree tilt makes about 93% of the best output in Sydney against 86% for panels laid flat.
Sources
- PVGIS photovoltaic geographical information system, European Commission Joint Research Centre, PVGIS 5.3, ERA5 radiation data 2005 to 2023, queried 14 November 2026
- Bureau of Meteorology climate averages, Sydney Airport AMO (066037), mean daily solar exposure, checked November 2026
- Bureau of Meteorology climate averages, Hobart Airport West (094008), checked November 2026
- Solar Choice solar panel price index, standard offers by city, November 2026
- Clean Energy Council, consumer guide to buying household solar panels, 2011 edition, for the older per-city output convention
About this guide
This guide was written by the Solar Cobber editorial team from independent desk research checked in November 2026. Solar Cobber is a free directory that may earn referral or advertising fees from installers, and commercial relationships never affect our content. The output figures are our own calculations from a public modelling tool, not measurements of your roof, and nothing here is financial advice. To report a correction, use our contact page.
Filed under Solar Basics
Back to blog