
Solar panel efficiency is the share of the sunlight hitting a panel that it turns into electricity. As at November 2026, home panels sold in Australia range from about 22% to 25.0% efficient, with AIKO’s Neostar 3P54 at the top of the models we have reviewed. Higher efficiency means more watts from the same roof area, not more kilowatt hours from each rated kilowatt, so it matters most on small roofs.
Key facts
- As at November 2026, the AIKO Neostar 3P54 datasheet lists up to 25.0% module efficiency, the highest of the 11 residential panel models in this guide, while the LONGi Hi-MO X6 and Tindo Walara G4P (440 W) sit at 22.5% and 22.6%.
- A solar panel’s efficiency is measured at 25 degrees Celsius cell temperature, but Australian summer roofs often push cells 40 degrees above that, which cuts output by about 9.6% to 12% depending on the panel’s temperature coefficient.
- Panels with the same rated kilowatts produce about the same energy whatever their efficiency; a 24% panel and a 21% panel rated at 6.6 kW in the same place differ in roof area, not in yearly output.
- The Jordan and Kurtz review of about 2,000 field measurements for the US National Renewable Energy Laboratory found a median degradation rate of 0.5% a year for crystalline silicon panels.
- Australian warranties for panels in our reviews guarantee between 87.4% and 92.0% of rated output at year 25, a gap of 4.6 percentage points.
- LONGi announced a 27.81% efficient silicon solar cell in April 2025, certified by ISFH in Germany; it is a laboratory cell, not a roof panel.
Source: Manufacturer datasheets summarised in Solar Cobber reviews; NREL; LONGi, November 2026.
What does solar panel efficiency mean?
Solar panel efficiency is the percentage of sunlight energy that falls on the panel surface and leaves as electrical power under standard test conditions of 1,000 watts per square metre of sunlight at 25 degrees Celsius cell temperature. A 440 W panel with an area of 1.95 square metres is about 22.5% efficient, because 440 W divided by (1.95 m2 x 1,000 W/m2) is 0.225.
The number you see on a datasheet is therefore a lab-style rating. It does not tell you how the panel behaves on a 65 degree roof at 3 pm, and it does not tell you how much energy you will bank over 25 years. Those depend on the temperature coefficient and the degradation guarantee, covered below.
Efficiency is also different from system efficiency. Inverter losses, cable losses, dirt and shade come on top of the panel rating, which is why Australian output figures such as the Clean Energy Regulator zone ratings are lower than a simple panel sum would suggest. For how a system turns sunlight into power, see how solar panels work.
What is the most efficient solar panel in Australia in 2026?
The most efficient residential panel in our reviews is the AIKO Neostar 3P54 at up to 25.0%, followed by the LONGi Hi-MO X10 at up to 24.74% and the Jinko Tiger Neo 3.0 at 24.27%. All three use n-type cells, and the top two use back contact designs.
Each figure below is the top of the efficiency range on the current Australian datasheet, so it applies to the highest power class only. Lower power classes of the same panel are a point or two lower. The full detail sits in our reviews of the AIKO Neostar, LONGi Hi-MO X6 and X10, Jinko Tiger Neo, Maxeon 7, Canadian Solar TOPHiKu6, JA Solar DeepBlue 4.0, Trina Vertex S+, REC Alpha Pure-RX and Tindo panels.
View the data as a table
| Efficiency | |
|---|---|
| AIKO Neostar 3P54 | 25.00% |
| LONGi Hi-MO X10 | 24.74% |
| Jinko Tiger Neo 3.0 | 24.27% |
| Maxeon 7 | 24.10% |
| Canadian Solar TOPHiKu6 | 23.80% |
| JA Solar DeepBlue 4.0 | 23.80% |
| Trina Vertex S+ | 23.80% |
| REC Alpha Pure-RX | 22.60% |
| Tindo Walara G4P 440 W | 22.60% |
| LONGi Hi-MO X6 | 22.50% |
AIKO’s back contact panel leads on efficiency, and every model listed is within 2.5 percentage points of the next.
The spread is narrow: from 22.5% to 25.0% is a difference of 2.5 percentage points. In practice that is about 11% more watts per square metre at the top than at the bottom.
| Panel | Cell technology | Top efficiency | Power range | Size (mm) | Source |
|---|---|---|---|---|---|
| AIKO Neostar 3P54 | N-type all back contact | 25.0% | 475 to 500 W | 1762 x 1134 | AIKO datasheet |
| LONGi Hi-MO X10 | HPBC 2.0 back contact | 24.74% | 475 to 505 W | 1800 x 1134 | LONGi datasheet |
| Jinko Tiger Neo 3.0 | N-type TOPCon | 24.27% | 460 to 485 W | 1762 x 1134 | Jinko datasheet |
| Maxeon 7 | IBC back contact | 24.1% | 435 to 445 W | 1787 x 1035 | Maxeon datasheet |
| Canadian Solar TOPHiKu6 | N-type TOPCon | 23.8% | 445 to 475 W | 1762 x 1134 | Canadian Solar datasheet |
| JA Solar DeepBlue 4.0 | N-type TOPCon | 23.8% | 450 to 475 W | 1762 x 1134 | JA Solar datasheet |
| Trina Vertex S+ | N-type i-TOPCon | 23.8% | 450 to 475 W | 1762 x 1134 | Trina datasheet |
| REC Alpha Pure-RX | Heterojunction | 22.6% | 440 to 470 W | 1728 x 1205 | REC datasheet |
| Tindo Walara G4P | N-type TOPCon | 22.6% (440 W) | 440 W and 475 W | 1722 x 1133 | Tindo datasheet |
| LONGi Hi-MO X6 | HPBC back contact | 22.5% | 420 to 450 W | 1722 x 1134 | LONGi datasheet |
For a wider buyer comparison see best solar panels in Australia and best premium solar panels. Panel dimensions are covered in solar panel sizes and dimensions.
What solar cell technologies are used: PERC, TOPCon, HJT and back contact?
Four cell designs cover almost every panel on Australian roofs in 2026: PERC, TOPCon, heterojunction (HJT) and back contact. TOPCon is the common choice for mainstream panels, while heterojunction and back contact are the premium options with the lowest heat losses or highest efficiency.
- PERC (passivated emitter and rear cell) is the older p-type design. A p-type cell uses silicon doped with boron, and an n-type cell uses silicon doped with phosphorus. N-type cells generally degrade less in the early years, which is why newer warranties are better.
- TOPCon (tunnel oxide passivated contact) adds a thin passivation layer to an n-type cell. It is the mainstream n-type design, used by Jinko, Trina, JA Solar, Canadian Solar and Tindo in the panels reviewed here.
- Heterojunction (HJT) layers thin amorphous silicon on both sides of an n-type wafer. REC’s Alpha Pure-RX uses it, and it carries the lowest temperature coefficient we found, -0.24% per degree.
- Back contact (IBC, ABC, HPBC) moves all the metal contacts to the rear, so the front of the cell is unobstructed. AIKO, LONGi and Maxeon use it, which is how they reach the highest efficiencies and an all-black look.
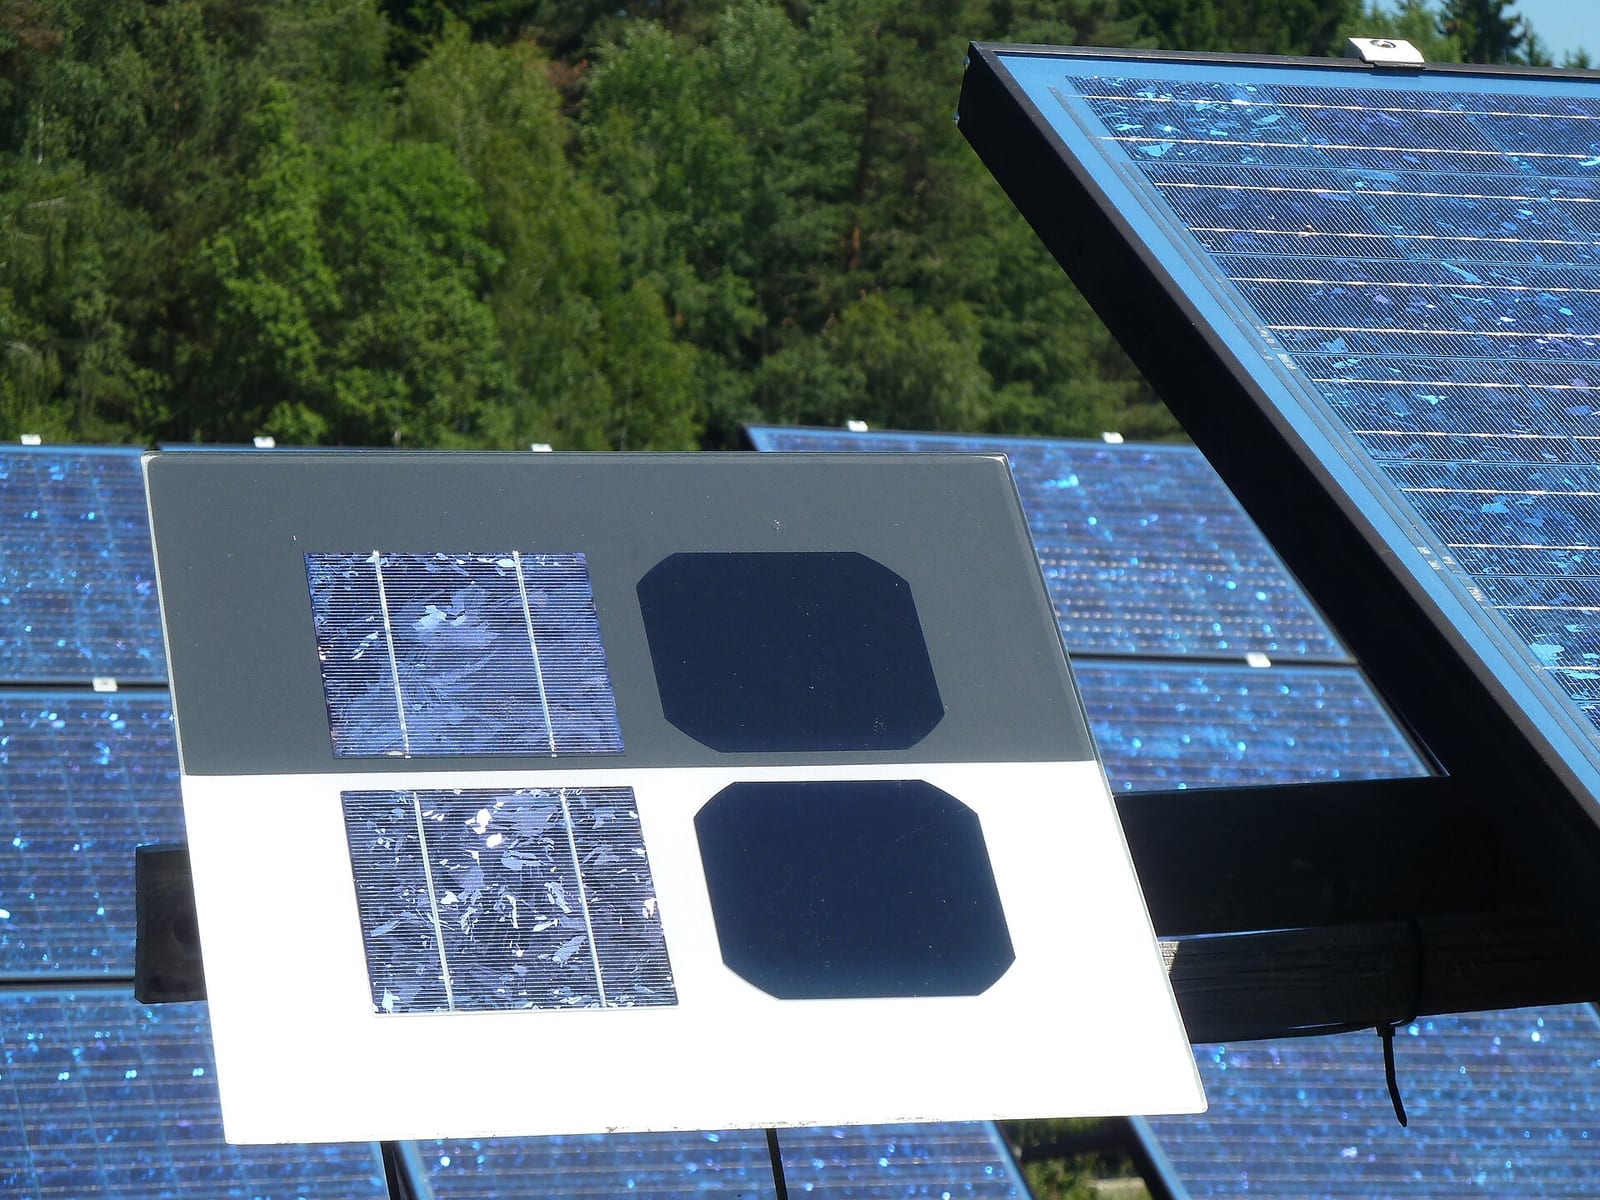
Is n-type better than p-type? On the datasheets we reviewed, yes: n-type panels carry lower temperature coefficients and longer performance warranties than the older p-type generation. TOPCon versus back contact is a closer call: back contact leads on efficiency and appearance, while TOPCon usually costs less. We cover the price gap below.
Can solar cells ever reach 100% efficiency?
No. A single-junction solar cell has a physical ceiling of about 33.7% under the Shockley-Queisser limit, because some sunlight is too low in energy to be absorbed and some high-energy light is lost as heat. This explainer from Looking Glass Universe, a physicist-run science channel, shows why the limit is 33.7%.
Real cells are getting close to the practical limit for silicon. LONGi announced a 27.81% hybrid back contact silicon cell in April 2025, certified by the Institute for Solar Energy Research in Hameln, Germany (LONGi announcement). The same company reported a crystalline silicon and perovskite tandem cell at 34.85%, certified by NREL (LONGi announcement). These are laboratory cells, not products you can buy for a roof, and records may have been broken since.
How does heat affect solar panel efficiency in Australia?
Hot cells make less power. Every panel has a temperature coefficient, the percentage of output it loses for each degree the cells run above 25 degrees Celsius. Panels with coefficients of -0.24% to -0.30% per degree lose roughly 9.6% to 12% of their rated output when cells are 40 degrees above the test condition.
A cell at 65 degrees is normal on an Australian summer afternoon, when air temperature is mid 30s and a dark roof adds the rest. The table and chart below apply the coefficient from each panel’s datasheet to a 40 degree rise.
Solar Cobber calculation: loss at +40 degrees = temperature coefficient (% per degree) x 40.
Source: Solar Cobber calculation from datasheet temperature coefficients (-0.24% to -0.30% per degree), checked October to November 2026. Hot-roof loss only; it applies to the hottest hours, not the whole year.
View the data as a table
| Output lost | |
|---|---|
| Tindo Walara G4P | 12.0% |
| Canadian Solar TOPHiKu6 | 11.6% |
| JA Solar DeepBlue 4.0 | 11.6% |
| Trina Vertex S+ | 11.6% |
| LONGi Hi-MO X6 | 11.6% |
| Maxeon 7 | 10.8% |
| AIKO Neostar 3P54 | 10.4% |
| Jinko Tiger Neo 3.0 | 10.4% |
| LONGi Hi-MO X10 | 10.4% |
| REC Alpha Pure-RX | 9.6% |
The heterojunction REC panel loses about 9.6% on a hot roof, against 12.0% for the Tindo, a 2.4 percentage point gap that is as large as the whole spread in headline efficiency.
| Panel | Temperature coefficient of power | Loss at +40 degrees | Cell technology |
|---|---|---|---|
| REC Alpha Pure-RX | -0.24% per degree | 9.6% | Heterojunction |
| AIKO Neostar 3P54 | -0.26% per degree | 10.4% | Back contact |
| Jinko Tiger Neo 3.0 | -0.26% per degree | 10.4% | TOPCon |
| LONGi Hi-MO X10 | -0.26% per degree | 10.4% | Back contact |
| Maxeon 7 | -0.27% per degree | 10.8% | Back contact |
| Canadian Solar, JA Solar, Trina, LONGi Hi-MO X6 | -0.29% per degree | 11.6% | TOPCon or back contact |
| Tindo Walara G4P | -0.30% per degree | 12.0% | TOPCon |
This is the figure that matters most for Queensland, WA, Northern Territory and inland homes. Our guide to solar panels in Australian heat and the cloudy day output guide cover the wider picture. Annual losses are smaller than the table because roofs are not at 65 degrees all day, and we have not tried to publish a single yearly figure.
How fast do solar panels lose efficiency over time?
Most panels lose about 0.4% to 0.5% of their rated output each year, and warranties promise a floor. The Jordan and Kurtz NREL review of about 2,000 field rates reported a median of 0.5% a year for crystalline silicon, with a higher mean of about 0.8% pulled up by weaker products (NREL via OSTI).
Warranties are more useful than the study for a buyer because they are written down. The Australian panel warranties in our reviews guarantee between 87.4% and 92.0% of rated output at year 25. The numbers for 30-year warranties are derived by adding back five years of the stated annual loss.
Solar Cobber calculation: guaranteed output at year 25 = year 30 guarantee + (5 x annual loss) for 30-year warranties; the Maxeon figure is its year 40 guarantee of 88.25% + (15 x 0.25%); REC and Tindo state year 25 directly.
Source: Australian performance warranty terms as summarised in Solar Cobber product reviews, checked October to November 2026. Solar Cobber calculation for the 30 and 40 year warranties; see text for the formula.
View the data as a table
| Guaranteed output at year 25 | |
|---|---|
| Maxeon 7 | 92.0% |
| REC Alpha Pure-RX | 92.0% |
| AIKO Neostar 3P54 | 90.6% |
| Jinko Tiger Neo 3.0 | 90.6% |
| Trina Vertex S+ | 89.4% |
| Canadian Solar TOPHiKu6 | 89.4% |
| JA Solar DeepBlue 4.0 | 89.4% |
| Tindo Walara G4P | 87.4% |
Maxeon and REC guarantee 92% at year 25, while Tindo, Trina, Canadian Solar and JA Solar guarantee 87.4% to 89.4%.
| Panel | Year one loss allowed | Annual loss after | Guarantee at year 25 | Performance warranty length |
|---|---|---|---|---|
| Maxeon 7 | 2% | 0.25% | 92.0% | 40 years (88.25% at year 40) |
| REC Alpha Pure-RX | 2% | 0.25% | 92.0% | 25 years |
| AIKO Neostar 3P54 | 1% | 0.35% | 90.6% | 30 years (88.85% at year 30) |
| Jinko Tiger Neo 3.0 | 1% | 0.35% | 90.6% | 30 years (88.85% at year 30) |
| Trina Vertex S+ | 1% | 0.4% | 89.4% | 30 years (87.4% at year 30) |
| Canadian Solar TOPHiKu6 | 1% | 0.4% | 89.4% | 30 years (87.4% at year 30) |
| JA Solar DeepBlue 4.0 | 1% | 0.4% | 89.4% | 30 years (87.4% at year 30) |
| Tindo Walara G4P | 3% | 0.4% | 87.4% | 25 years |
What does that gap mean in energy? The Clean Energy Regulator zone 3 rating is 1.382 MWh per kW per year, which covers Sydney, Brisbane, Adelaide, Perth and Canberra (Clean Energy Regulator zone ratings). A 6.6 kW system rated that way is about 9,121 kWh a year (6.6 x 1,382). If panels sit at the guarantee floor at year 25, a 92.0% panel produces about 128 kWh a year more than a 90.6% panel (1.4% of 9,121 kWh) and about 237 kWh more than an 89.4% panel (2.6% of 9,121 kWh). At an illustrative A$0.10 a kWh that is about A$13 to A$24 a year. Real panels usually beat the floor, so treat this as the worst case the warranty allows. More on lifespan is in how long solar panels last.
How much roof area does higher efficiency save?
Each extra percentage point of efficiency saves roughly 1.3 square metres on a 6.6 kW system, so a 25% panel needs about 6.6 square metres less panel area than a 20% one. The saving comes straight from the maths: area needed is system kilowatts divided by efficiency.
Solar Cobber calculation: panel area (m2) = system size (kW) / efficiency, because a 100% efficient panel would deliver 1 kW per square metre.
Source: Solar Cobber calculation: 6.6 kW divided by module efficiency. Formula: area = 6.6 kW / efficiency.
View the data as a table
| Panel area | |
|---|---|
| 20% | 33.0 m2 |
| 21% | 31.4 m2 |
| 22% | 30.0 m2 |
| 23% | 28.7 m2 |
| 24% | 27.5 m2 |
| 25% | 26.4 m2 |
Moving from 22% to 25% frees about 3.6 square metres on a 6.6 kW system, roughly the area of two panels.
For most roofs this is not decisive, since 6.6 kW of any modern panel fits on a typical roof. It becomes important on small or shaded roofs, or when you want to reach 10 kW within a fixed area. Our solar panel sizes and dimensions and how many solar panels do I need guides turn this into panel counts.
Is a higher efficiency solar panel worth paying for?
Usually only when roof area is tight. Efficiency does not set price: in the Solar Choice November 2026 retail estimates, the REC panel at 22.6% costs more per watt than the AIKO at 25.0%, because REC sells on heat tolerance, warranty and brand.
Solar Choice lists hardware-only retail prices per watt in its November 2026 price page. We multiplied the mid-point of each range by 6,600 W.
Solar Cobber calculation: panel hardware for 6.6 kW = mid-point price per watt x 6,600 W. These are panels only, not installed systems.
Source: Solar Choice Solar Panel Price Index, November 2026 (mid-point of per-watt ranges x 6,600 W).
View the data as a table
| Panel hardware for 6.6 kW | |
|---|---|
| REC 400 to 410 W | A$4,389 |
| Tindo 400 to 420 W | A$4,290 |
| SunPower 450 to 455 W | A$3,003 |
| AIKO 470 to 475 W | A$2,046 |
| Jinko 440 to 475 W | A$1,749 |
| Trina 440 W | A$1,650 |
| Seraphim 440 W | A$1,452 |
The REC and Tindo panels cost about A$2,700 more than Trina for the same 6.6 kW, while AIKO’s back contact panels cost about A$400 more than Trina at the mid-point.
| Panel brand | Efficiency | Hardware price per watt (Solar Choice, Nov 2026) | Hardware for 6.6 kW | Extra over Trina |
|---|---|---|---|---|
| Seraphim | not in our reviews | A$0.21 to A$0.23 | about A$1,452 | about A$198 less |
| Trina | up to 23.8% | A$0.25 | A$1,650 | baseline |
| Jinko | up to 24.27% | A$0.25 to A$0.28 | about A$1,749 | about A$99 |
| AIKO | up to 25.0% | A$0.31 | A$2,046 | A$396 |
| SunPower | not in our reviews | A$0.44 to A$0.47 | about A$3,003 | about A$1,353 |
| Tindo | up to 22.6% | A$0.60 to A$0.70 | about A$4,290 | about A$2,640 |
| REC | up to 22.6% | A$0.63 to A$0.70 | about A$4,389 | about A$2,739 |
A sensible reading: pay more for efficiency if you are short of roof, pay more for a low temperature coefficient and a strong warranty if you want the best output on hot roofs over 25 years, and pay nothing extra if a mainstream TOPCon panel fits your roof and budget. Installed system prices by size are in solar panel cost in Australia, and orientation matters more than panel choice, as covered in solar panel angle and orientation.
When to call an installer
Ask your installer to put the model number, the datasheet efficiency, the temperature coefficient and the Australian performance warranty on the quote. Check that the panel is on the Clean Energy Council approved list, and compare at least three quotes. Our directory of installers and the top 10 solar panel installers are a starting point. Solar Cobber does not verify any installer’s accreditation, so check the Clean Energy Council approved retailer list and the Solar Accreditation Australia register yourself.
FAQ
What is a good solar panel efficiency in Australia?
A good efficiency for a new home panel in 2026 is 22% to 25%. The reviewed models range from 22.5% for the LONGi Hi-MO X6 to 25.0% for the AIKO Neostar 3P54, and at the same rated power each delivers about the same yearly energy.
What is the most efficient solar panel in Australia?
The AIKO Neostar 3P54 is the most efficient residential panel in our reviews at up to 25.0%, based on its datasheet checked in November 2026. The LONGi Hi-MO X10 follows at up to 24.74%.
Does higher efficiency mean more electricity?
No, not at the same rated power. A 6.6 kW system produces about the same energy whether made of 22% or 25% panels in the same location. Higher efficiency means fewer panels or less roof area, or more kilowatts on a fixed area.
What is a solar panel temperature coefficient?
It is the percentage of power a panel loses for each degree its cells run above 25 degrees Celsius. Reviewed Australian panels range from -0.24% to -0.30% per degree, which works out to about 9.6% to 12% loss with cells 40 degrees above the test condition.
How much efficiency do solar panels lose each year?
Typical warranty rates are 0.25% to 0.4% a year after the first year, and the NREL review of field data found a median of 0.5% a year. Warranties guarantee between 87.4% and 92.0% of rated output at year 25 for the panels we reviewed.
Is n-type better than p-type solar panels?
On current datasheets, n-type panels generally have lower temperature coefficients and longer performance warranties than older p-type panels. Most premium and mainstream panels sold in Australia in 2026 are n-type TOPCon, heterojunction or back contact.
TOPCon or back contact: which is better?
Back contact panels lead on efficiency and an all-black look, with AIKO at 25.0% and LONGi X10 at 24.74%. TOPCon panels from Trina, JA Solar, Canadian Solar and Jinko usually cost less per watt, and Jinko’s Tiger Neo 3.0 matches the back contact temperature coefficient of -0.26% per degree.
Do solar panels get less efficient in heat?
Yes. Output falls as cells heat up, by about 0.24% to 0.30% of rated power for each degree above 25 degrees Celsius. Heterojunction panels such as REC’s Alpha Pure-RX lose the least, and the loss only applies during the hottest hours.
Do dirty panels reduce efficiency?
Dirt and shade reduce the light reaching the cells and therefore output, but they do not change the panel’s rated efficiency. We have not found an Australian figure we can verify for the size of that loss, so see how to clean solar panels and solar panel cleaning cost for the practical advice.
Sources
- AIKO, LONGi, Jinko, Maxeon, Canadian Solar, JA Solar, Trina, REC and Tindo Australian datasheets and warranty documents as summarised in our solar panel reviews, checked October to November 2026
- Solar Choice, Solar Panel Price Index (November 2026)
- Clean Energy Regulator, postcode zone ratings and zones for solar systems
- NREL, Jordan and Kurtz, Photovoltaic Degradation Rates: an Analytical Review (OSTI)
- LONGi, 27.81% HIBC silicon cell record and tandem record announcement
- LONGi, 34.85% silicon-perovskite tandem cell announcement
About this guide
Written by the Solar Cobber editorial team from independent desk research checked in November 2026. Solar Cobber is a free directory that may earn referral or advertising fees from installers; commercial relationships never affect our content. This guide is general information, not financial advice. To report a correction, use /contact.
Filed under Solar Basics
Back to blog